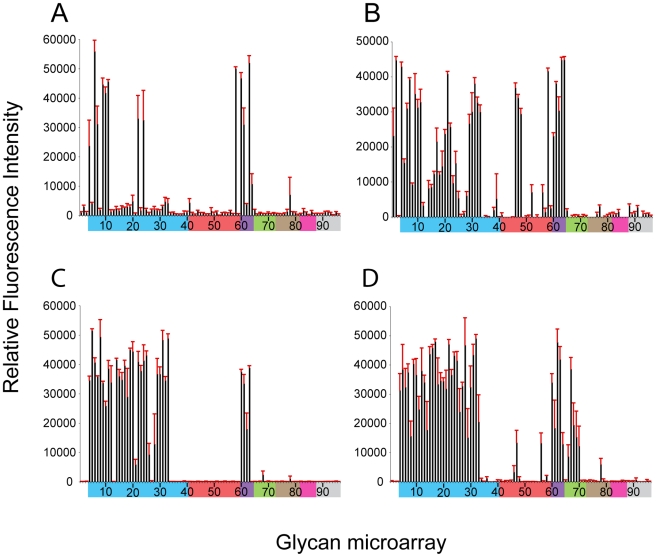
Figure 2. Receptor specificity of NY107 recHA and virus.
Glycan microarray analysis of recombinant NY107 HA (A) and NY107 virus (B) compared to the recHA (C) and virus (D) from a Eurasian lineage A/Netherlands/219/2003 H7 influenza virus that was circulating in the same year and also infected a human. Colored bars highlight glycans that contain α2-3 SA (blue) and α2-6 SA (red), α2-6/α2-3 mixed SA (purple), N-glycolyl SA (green), α2-8 SA (brown), β2-6 and 9-O-acetyl SA, and non-SA (grey). Error bars reflect the standard error in the signal for six independent replicates on the array. Structures of each of the numbered glycans are found in Table S4.

