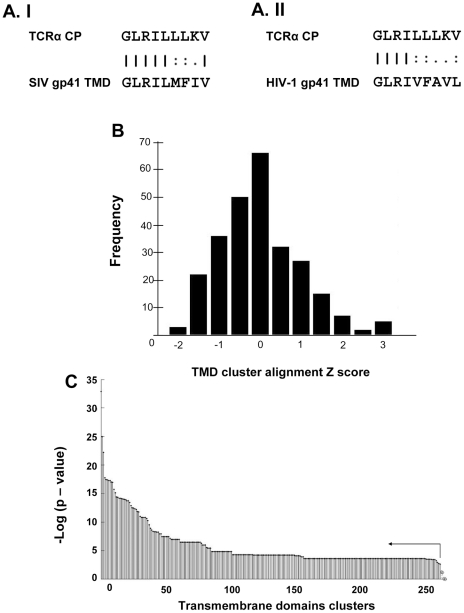
Figure 2. Bioinformatics database analysis.
A. The sequence alignments obtained from the EMBOSS package: Needle global alignment analysis. I) TCRα CP / SIV gp41 TMD sequences alignment II) TCRα CP / HIV-1 gp41 TMD sequences alignments. B. Z-Score alignment histogram. TMD Entries scores were clustered according to taxonomic species division. The mean of each cluster was Z-normalized. The histogram describes the distribution of alignment scores over the 265 clusters dataset C. Wilcoxon Rank Test. The HIV-1 gp41 cluster (n = 47) was compared against all the other 264 clusters using Wilcoxon Rank Test. p-value results of comparisons are presented in a log scale. Significance of ranking was determined according to Benjamini-Hochberg method (E (FDR)<0.05). Clusters which are significantly lowered ranked over HIV-1 gp41 are marked (black dot) and presented left to the arrow. Cluster which were not significantly distinct in ranking from HIV-1 gp41 are marked (diamond).

