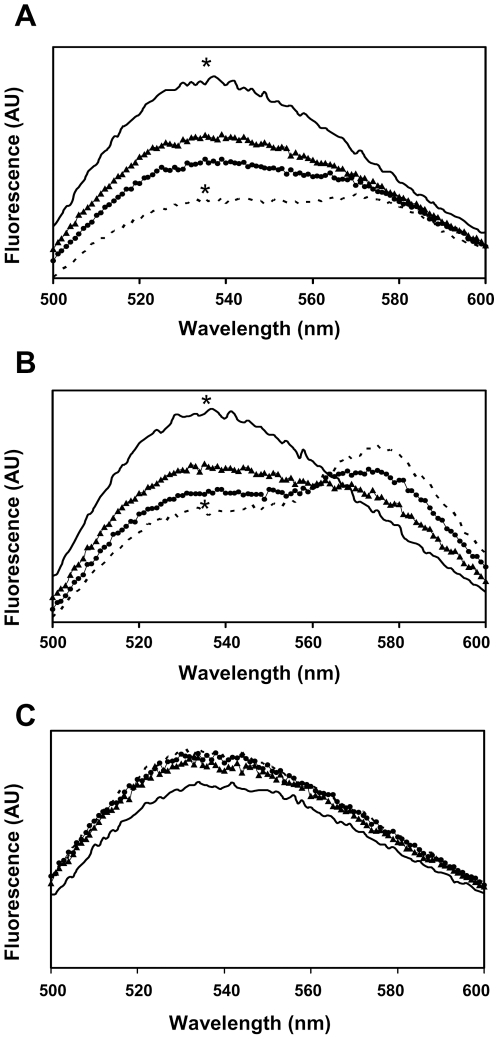
Figure 7. Fluorescence Energy Transfer (FRET) measurements reveal a specific interaction of the gp41 TMD and the TCRα CP.
Fluorescence spectra were obtained at room temperature, with excitation set at 467 nm (5-nm slit) and emission scan at 500–600 nm (10-nm slits). NBD-labeled CP peptide was added first from a stock solution in DMSO (final concentration 0.1 µM and a maximum of 0.25% (v/v) DMSO) to a dispersion of PC LUV (100 µM) in PBS. This was followed by the addition of: A. Rho labeled gp41 TMD peptide B. Rho labeled TCRα CP C. Rho labeled TAR/PS TM control peptide. Fluorescence spectra were obtained in four different ratios of Rho-peptide∶NBD-peptide: 0∶4 (black line), 1∶4 (black triangle), 2∶4 (black circle) and 3∶4 (dashed line). The fluorescence values were corrected by subtracting the corresponding blank (buffer with the same vesicles concentration). Statistical analysis was performed at the pick measurements (∼537 nm, n = 5, * p<0.05).

