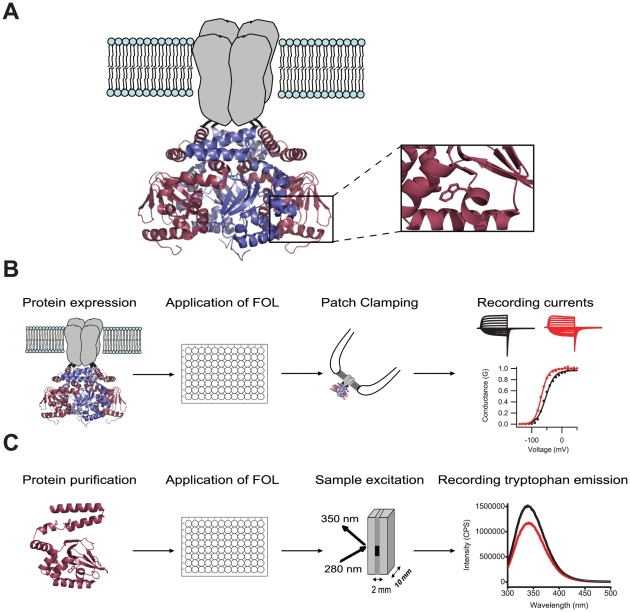
Figure 1. Schematic of the two-pronged screen designed to identify compounds that bind and regulate EAG1 channels.
(A) EAG1 channel subunits form tetramers around a central, K+ conducting pore. The ribbon representation is a homology model of mEAG1#505-702, obtained with SWISS-MODEL based on the crystal structure of the carboxy-terminal region of mHCN2 [42]. Enlarged view on the right shows a tryptophan residue at position 649 in the CNBD employed as a reporter of ligand binding. (B) For the electrophysiology arm of the screen, mEAG1 channels were expressed heterologously and the FOL pools were applied to inside-out patches containing these channels. The currents from EAG1 channels were recorded in the absence (black), presence (red) and after washout of FOL compounds. The conductance-voltage relationship was determined from the tail currents and normalized to the maximal conductance in the absence of drug. (C) For the fluorescence portion of the screen, mEAG1#505-702 was expressed and purified from bacteria. The FOL compounds were applied to mEAG1#505-702 in solution, the sample was placed in a quartz cuvette and excited at 280 nm wavelength. The mEAG1#505-702 emission spectra were recorded in the absence and presence of the FOL compounds (black and red traces, respectively).

