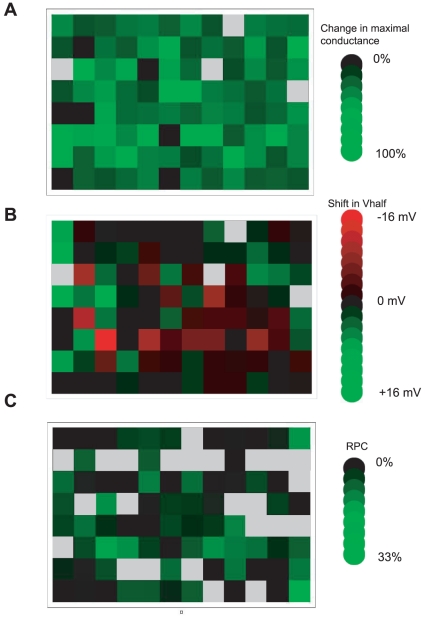
Figure 2. Summary of the screen results.
(A) The change in relative conductance of the electrophysiology portion of the screen is plotted in a black to green color gradient, with pools that did not change the relative conductance colored black, and those with a 100% reduction in conductance colored in bright green. (B) The shift of the Vhalf of the conductance versus voltage relationship from the electrophysiology portion of the screen is plotted in a black to green color gradient, for shifts to more positive potentials indicated by shades of green (with a shift of 16 mV indicated by the brightest green). Shifts of the conductance versus voltage relationship to more negative potentials are plotted in a black to red gradient, with the brightest red indicating a shift of −16 mV. The pools that repeatedly destroyed membrane seals and were removed from further analysis are indicated by grey boxes. (C) Results of the fluorescence based portion of the screen presented as RPC for each of the 96 FOL pools plotted in a black to green color gradient with pools that had no effect on the tryptophan colored in black, and largest effects colored in bright green. Grey boxes indicate the pools that had a larger effect on free tryptophan fluorescence than the fluorescence of the protein.

