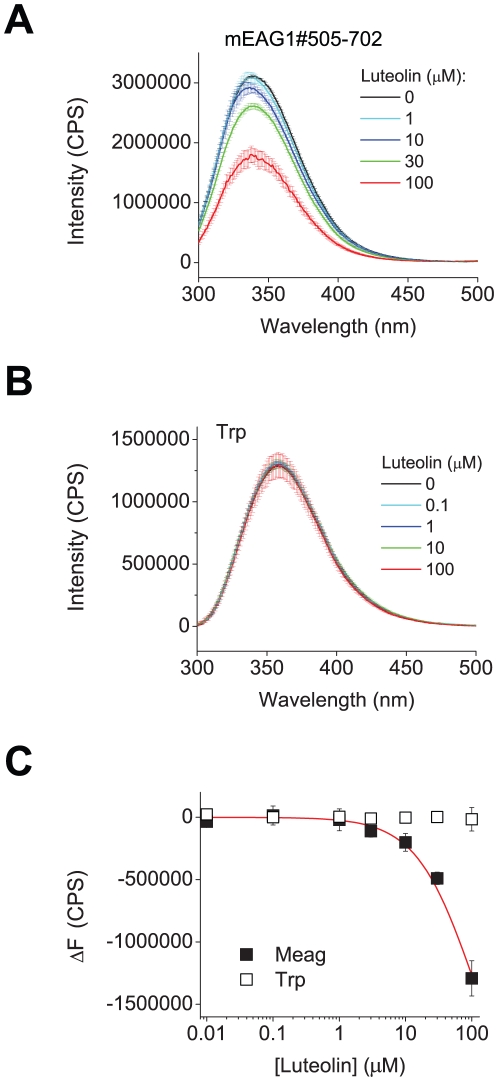
Figure 5. Luteolin reduced mEAG1#505-702 fluorescence in a concentration dependent manner.
(A) The inner filter corrected, and background subtracted emission spectra of mEAG1#505-702 recorded without and with the indicated concentrations of luteolin. (B) The inner filter corrected, and background subtracted emission spectra of free tryptophan in solution recorded without and with the indicated concentrations of luteolin. (C) Plots of change in the peak emission fluorescence intensity versus total luteolin concentration for mEAG#505-702 (filled squares) and free tryptophan (open squares), fit with equation (5). The peak fluorescence intensity corresponded to fluorescence intensity at 338 nm for mEAG1#505-702 and at 357 nm for free tryptophan. The change in the peak fluorescence intensity was calculated by subtracting averaged peak emission intensity for low concentrations of luteolin (intensities at 0, 0.01 and 0.1 µM luteolin at 338 nm) from the peak emission intensities. The binding affinity of luteolin was ≥100 µM for mEAG1#505-702.

