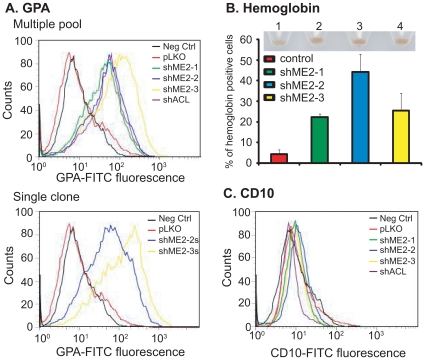
Figure 2. Stable knockdown of endogenous ME2 levels in K562 cells induces erythroid differentiation.
A: Expression levels of the erythroid marker glycophorin A on the surface of control (pLKO) and ME2 knockdown cells (shME2-1, shME2-2 and shME2-3) were compared using a mouse FITC-conjugated anti-human glycophorin A antibody. As a negative control (Neg Ctrl), cells were incubated with FITC-conjugated control IgG. As a positive control, K562 cells were transduced with ATP citrate lyase (ACL) shRNA lentiviral particles (ACL inhibition is known to cause erythroid differentiation in K562 cells – referenced in the text), and incubated with mouse FITC-conjugated anti-human glycophorin A antibody. The control clone was generated by stable transduction of control pLKO vector, while clones shME2-1, shME2-2 and shME2-3 were generated using the pLKO-ME2 shRNA lentivirus. Data are representative of three independent experiments. B: The percentage of hemoglobin-expressing cells in control (pLKO) and ME2 knockdown (shME2-1, shME2-2 and shME2-3) cell populations was determined by benzedrine staining. Plotted is the mean ± SD from triplicate samples from a representative experiment. Insert: cell pellets from ME2 knockdown cells. 1: pLKO; 2: shME2-1; 3: shME2-2; 4: shME2-3. Increased brown color is clearly visible in lanes 2, 3 and 4. C: Expression levels of the megakaryocytic marker CD10 on the surface of control (pLKO) and ME2 knockdown cells (shME2-1, shME2-2 and shME2-3) were compared using a mouse FITC-conjugated anti-human CD10 antibody. As a negative control (Neg Ctrl), cells were incubated with FITC-conjugated control IgG. The control clone was generated by stable transduction of control pLKO vector, while clones shME2-1, shME2-2 and shME2-3 were generated using the pLKO-ME2 shRNA let virus. Data are representative of three independent experiments.

