
Figure 2.
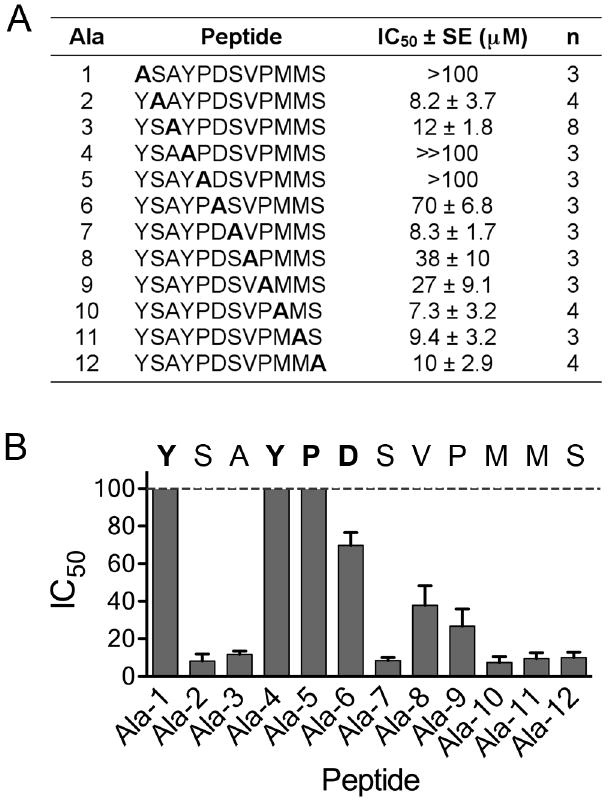
Alanine scan for the YSA peptide. (A) IC50 values for the indicated modified forms of the YSA peptide were calculated from curves of inhibition of ephrin-A5 AP binding to immobilized EphA2 Fc. The table shows average IC50 values, calculated from the indicated number of experiments (n). Ala-1 through Ala-12 are the peptides, where alanine replaces the indicated residue. Ala-3 is the original YSA peptide. For peptides Ala-1 and Ala-5 the IC50 values were too high to measure accurately (>100 μM); for the Ala-4 peptide no inhibition was detectable at 100 μM, which is the highest peptide concentration tested (≫100 μM). (B) The histogram shows the IC50 values ± SE. The sequence of the YSA peptide is shown, with the residues identified as critical for binding to EphA2 in bold.