
Figure 1.
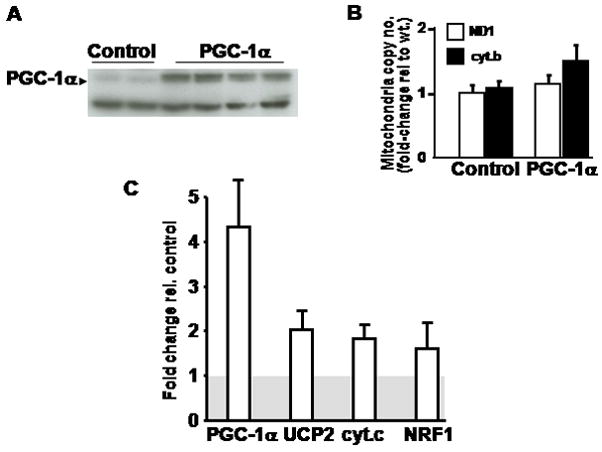
A) Western blot analysis shows upregulation of the PGC-1α after 72 hours of doxycycline administration to the mice. The lower non-specific band shows equal loading. B) Mitochondrial copy number as measured by the ratio of mitochondrial genomic transcripts (ND1 or cyt B) to genomic DNA (18s). ND1 – NADH dehydrogenase subunit 1, cyt B – cytochrome B. C) Relative transcript induction following doxycycline administration to mice. The grey shaded box represents the controls normalized to = 1. UCP2 – uncoupling protein 2, cyt c – cytochrome c, NRF1 – nuclear respiratory factor 1.