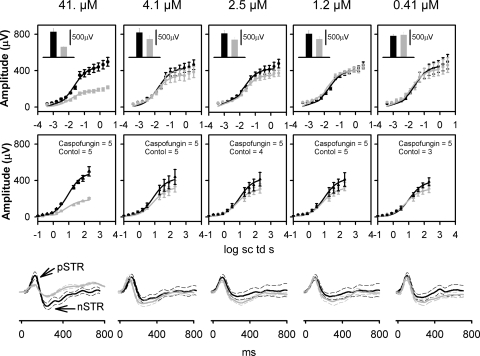
Figure 2.
Effects of intravitreal caspofungin on the mean ERG b- and a-wave stimulus-amplitude relationship and scotopic threshold responses. Caspofungin concentrations in micromolar are indicated at the top of each column. Top: Average dark-adapted electroretinogram (ERG) b-wave amplitudes (±SEM) for low scotopic energies plotted as a function of stimulus energy for the dark-adapted ERGs. Black circle: Intravitreal balanced salt solution–injected control subjects; gray circle: intravitreal C+balanced salt solution–injected subjects. Black and gray solid curves: best fit Naka-Rushton function for the balanced-saline control and C+balanced salt solution–injected eyes, respectively. Inset: average dark-adapted ERG b-wave amplitudes (±SEM) for a saturating flash of 2.3 log sc td s. (■) Balanced salt solution–injected control; ( ) C+balanced salt solution–injected eye. Middle: average dark-adapted electroretinogram (ERG) a-wave amplitudes (±SEM) plotted as a function of stimulus energy for the dark-adapted ERGs. Black circle: intravitreal balanced salt solution–injected controls; gray circle: intravitreal C+balanced salt solution–injected subjects. Black and gray solid curves: best fit Naka-Rushton function for the balanced salt solution control and C+balanced salt solution–injected eyes, respectively. Bottom: Averaged ERGs in response to low flash-energy (−3.7 log sc td s). Black solid lines: intravitreal balanced salt solution–injected controls; gray solid lines: intravitreal C+balanced salt solution–injected subjects. Dashed traces: ±1 SEM p-STR, positive scotopic threshold response; n-STR, negative scotopic threshold response.

