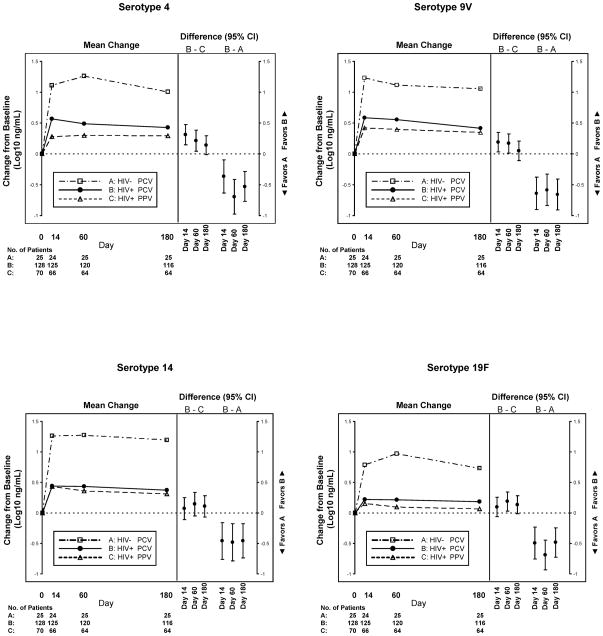
Figure 2.
Results from models estimating the change in IgG concentration (log10 ng/mL) from baseline to days 14, 60 and 180. For each plot, the panel on the left shows the mean changes for Group A (HIV-uninfected PCV arm), Group B (HIV-infected PCV arm) and Group C (HIV-infected PPV arm); while the panel on the right shows the differences (with 95% confidence intervals) between Groups A and B and between Groups B and C for the change from baseline to each post-vaccination visit. All models were adjusted for age, ethnicity, prior pneumonia, and baseline serotype concentration; models comparing Groups B and C were also adjusted for CD4 cell count, HIV RNA level, and use of HAART at baseline.

