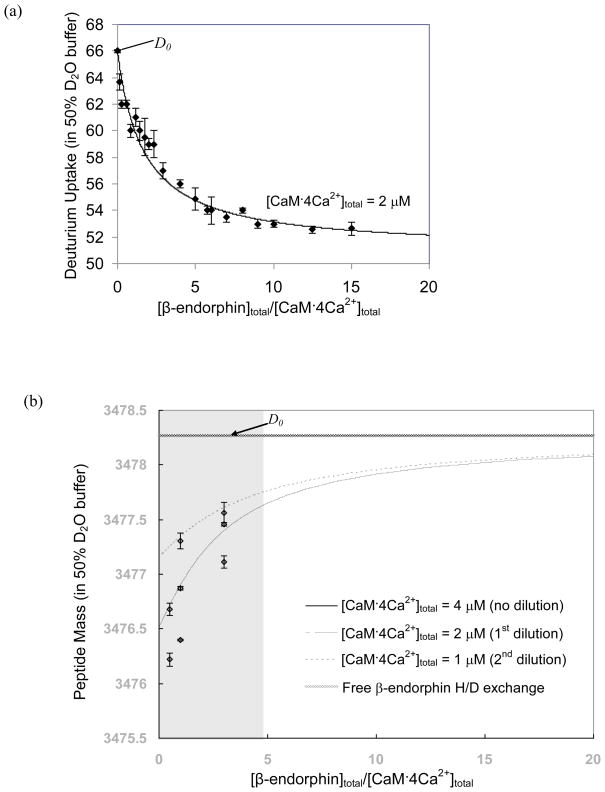
Figure 2.
Traditional PLIMSTEX (a) and dPLIMSTEX (b) fitting curves for CaM 4Ca2+: β-endorphin. The error bars shown for the data points represent the standard deviation from duplicate independent experiments. The D0 point in (a), is a single point for the apo state of the protein and also a “fit parameter”, whereas for (b), the D0 mass is for the unbound peptide, as such, D0 is depicted as a line representing the asymptote for the other curves in (b).

