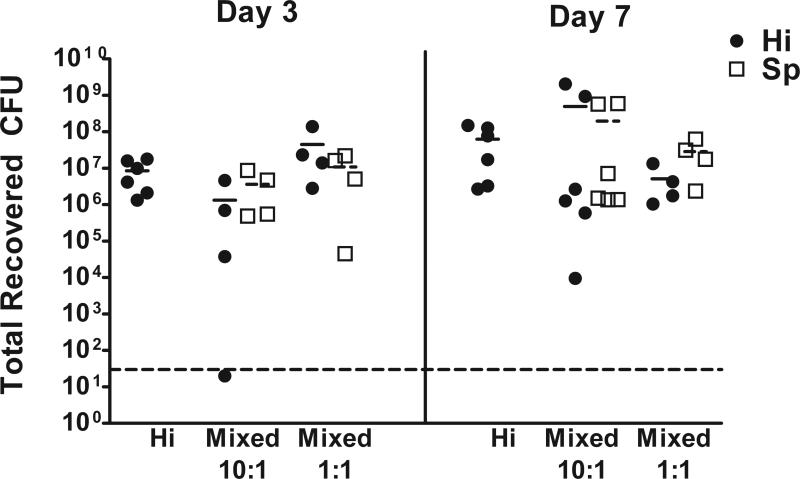
Figure 2. Persistent polymicrobial infection during exerimental OM coinfections.
Symbols represent total recovered CFU of each species recovered from the middle ears of animals. All animals received ~104 CFU of H. influenzae (Hi), coinfected animals also received ~103 CFU (10:1 ratio) or ~104 CFU of S. pneumoniae (Sp). Each point represents one ear. The dashed line indicates the limit of detection, the short solid and dashed lines represent the mean CFU for H. influenzae and S. pneumoniae for each group, respectively.

