Figure 6.
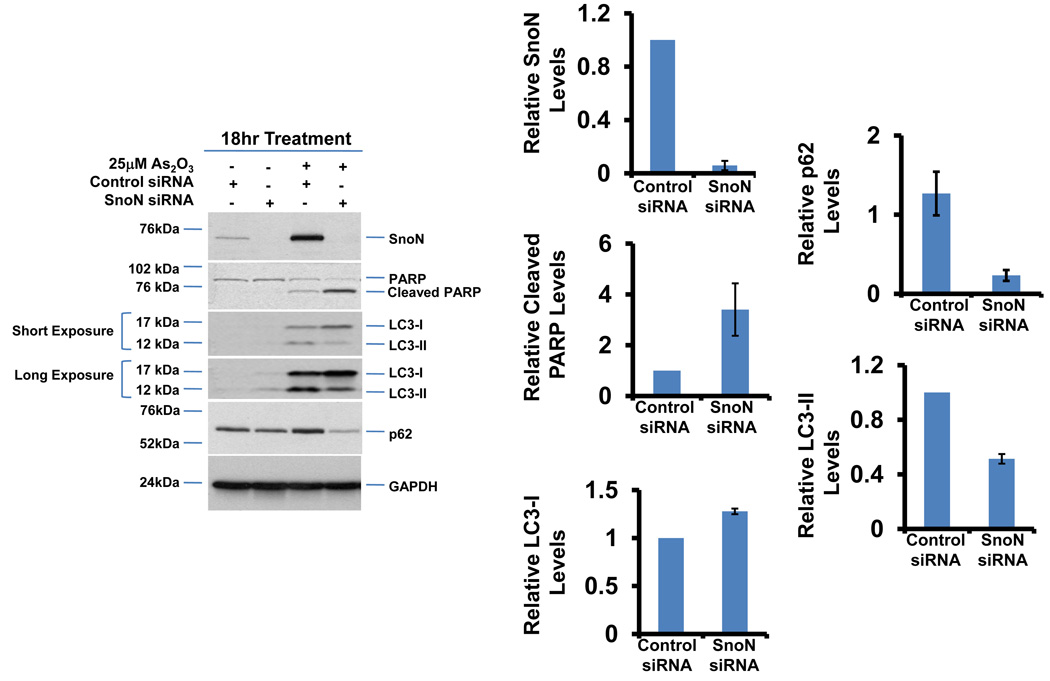
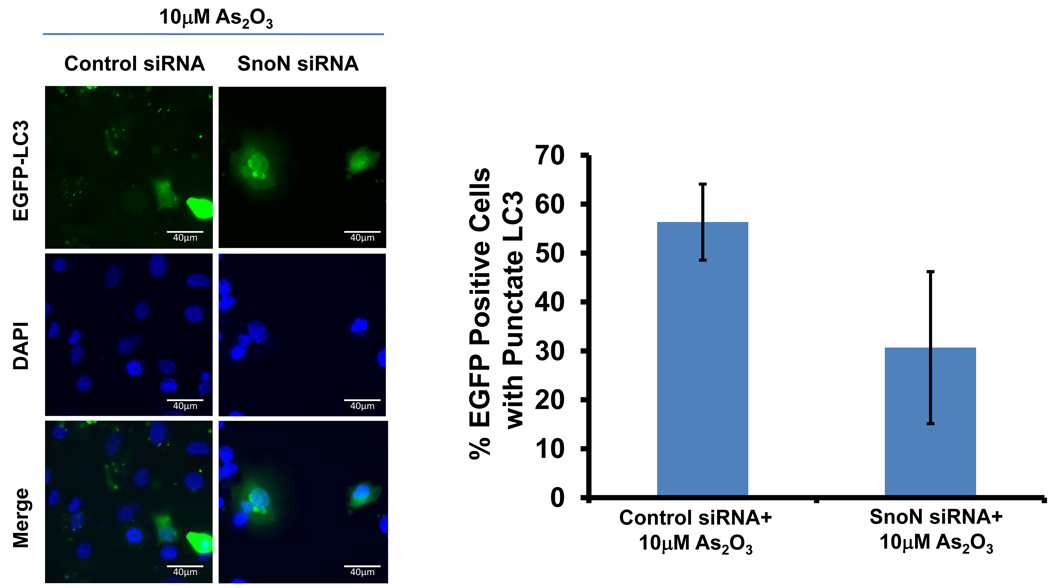
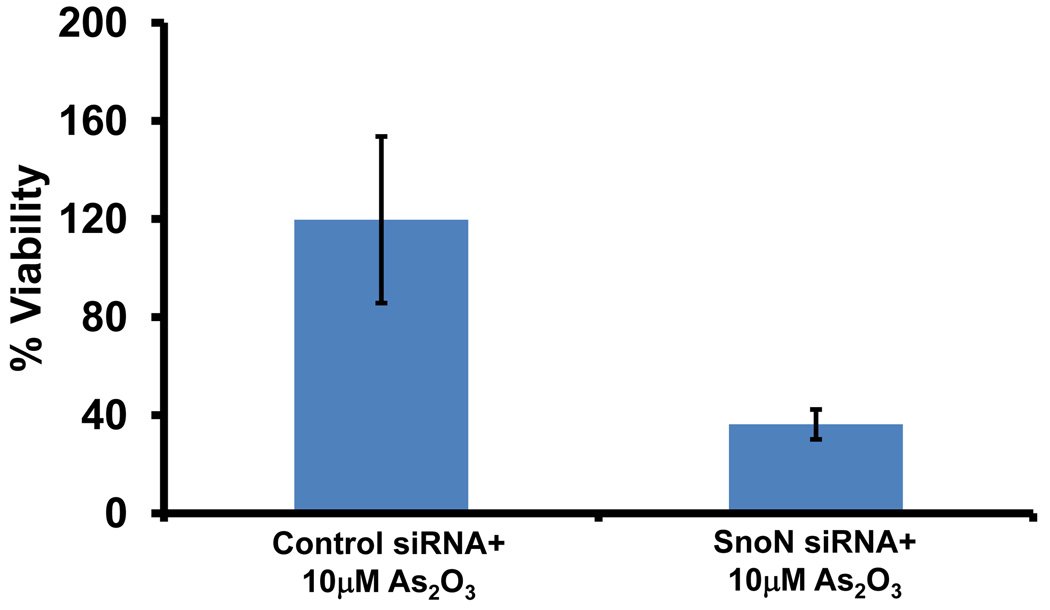
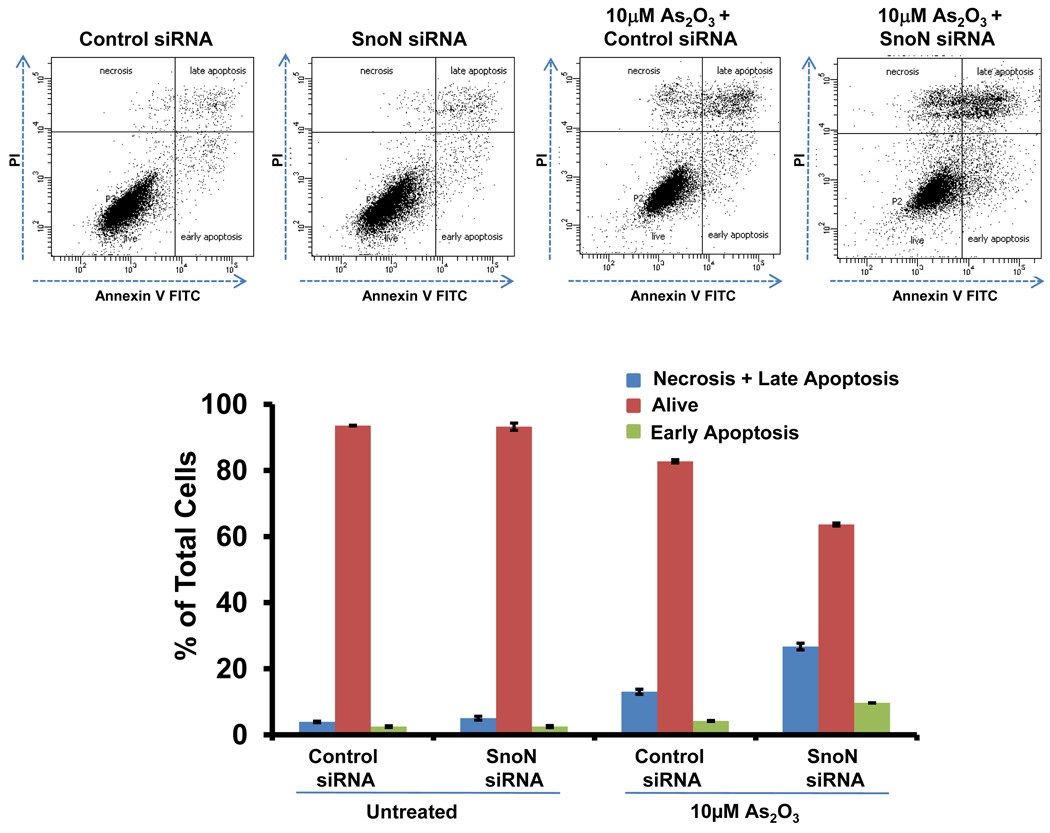
Knockdown of SnoN modulates the sensitivity of ovarian cancer cells to As2O3. (a) HEY cells were plated at 250,000 cells per well in 6-well plate. After overnight attachment, the cells were transiently transfected with (1) non-targeting (control) siRNA or (2) SnoN siRNA. Following 24 hours post-transfection, the cells were treated with 10µM As2O3. After 18 hours, light microscope images were captured at 40× magnification. The data shown are representative images. (b) (Left panel) HEY cells were seeded at 250,000 cells per well in 6-well plates. After 24 hours, the cells were transiently transfected with (1) non-targeting (control) siRNA or (2) SnoN siRNA. Following 24 hours post-transfection, the cells were treated with 25µM As2O3. After 18 hour incubation, cell lysates were harvested and western analysis was performed using the following antibodies: (1) SnoN, (2) PARP, (3) LC3, (4) p62, and (4) GAPDH as a loading control. The data shown are representative of 2 independent experiments. (Right panel) Densitometric analyses of selected western data (only As2O3-treated samples) which include SnoN, cleaved PARP, LC3-I, LC3-II, and p62. (c) (Left panel) HEY cells were plated at 250,000 cells per well in 6-well plate onto glass coverslips. After overnight attachment, cells were transfected with EGFP-LC3. Following recovery for 24 hours, cells were treated with (1) non-targeting (control) siRNA or (2) SnoN siRNA followed by cell treatment with 10µM As2O3. Immunofluorescence images are representative and were obtained at 40× magnification. (Right panel) Immunofluorescence data was quantitated and presented as the percentage of EGFP positive cells with punctate LC3 expression. The data shown are representative of 2 independent experiments. (d) Cell viability was assessed using the CellTiter-Glo assay in HEY cells transfected with control or SnoN siRNA followed by treatment for 18 hours with 10µM As2O3. Results are presented as % cell viability relative to non-targeting (control) siRNA treated cells. The data shown are representative of 2 independent experiments. (e) (Top panel) HEY cells were seeded at 250,000 cells per well in 6-well plates. Following 24 hours, cells were treated with (1) non-targeting (control) siRNA or (2) SnoN siRNA. Twenty-four hours post-transfection, cells were treated for 48 hours with 10µM As2O3 at which time both the floating and adherent cells were collected. Cells were stained with annexin V-FITC and propidium iodide (PI) followed by flow cytometric analysis. Raw data plots are shown as log fluorescence values of annexin V-FITC and PI on the X and Y axis, respectively. (Bottom panel) The data is displayed in a bar graph as the percentage of viable, early apoptotic, and late apoptotic/necrotic cells. The data shown are representative of 3 independent experiments.


