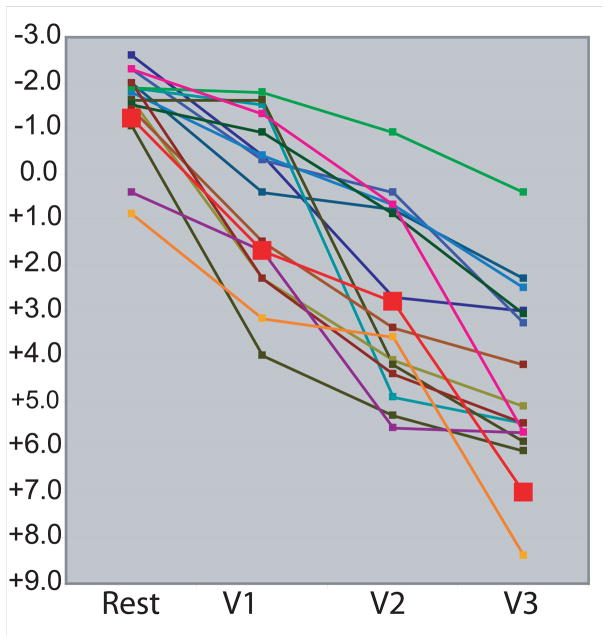
Figure 2. Individual progression of prolapse in women with change of at least 2 cm.
The progression of prolapse from rest through each maximum Valsalva attempt (V1, V2, V3) for change ≥ 2cm. Prolapse progression from Figure 1 represented by bold black line with white boxes (red boxes on color image). “0” represents the level of the inferior edge of the pubic bone which is the solid line in Figure 1.

