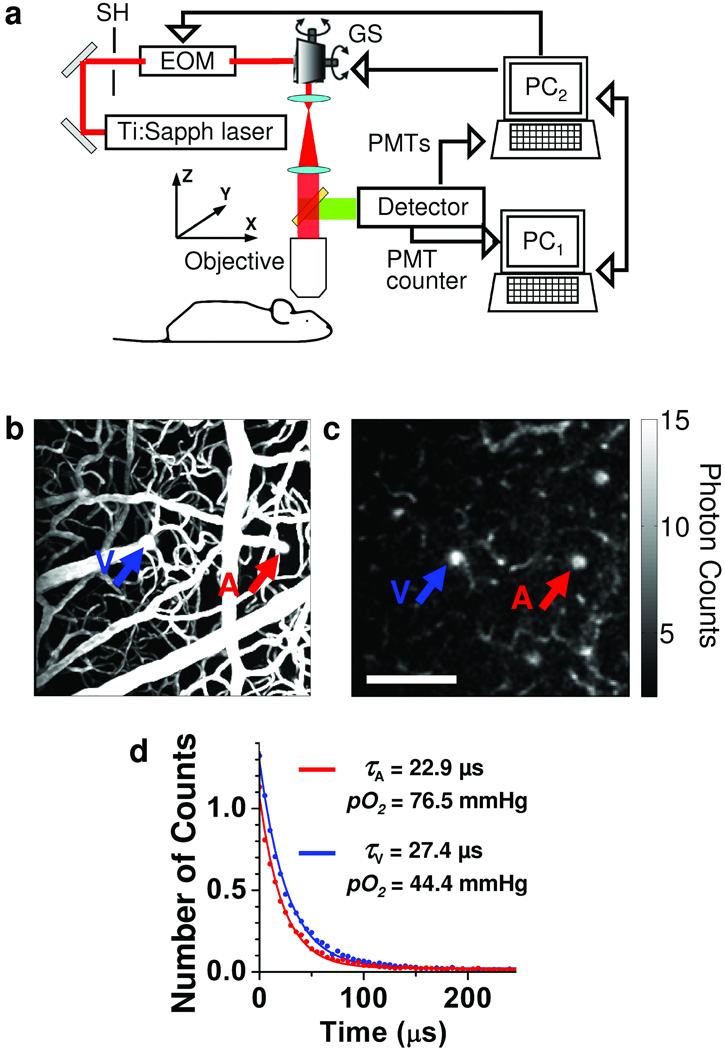
Figure 1. Phosphorescence detection procedure.
(a) Experimental setup. PC1 and PC2 – computers, SH – shutter, EOM – electro-optic modulator, GS – galvanometer scanner. (b) Maximum intensity projection (MIP) along z direction of a 250 µm thick stack in the mouse cortex. The vasculature was labeled with FITC. (c) Phosphorescence intensity image of microvasculature obtained at 166 µm depth below the cortical surface. The color bar shows the average number of counts in each pixel collected during single phosphorescence decay. Scale bar, 100 µm. (d) Experimental measurement (dots) and corresponding single exponential fits (solid lines) of two phosphorescence decays from the diving arteriole (A, red) and ascending venule (V, blue), with positions marked with the arrows in (b) and (c).

