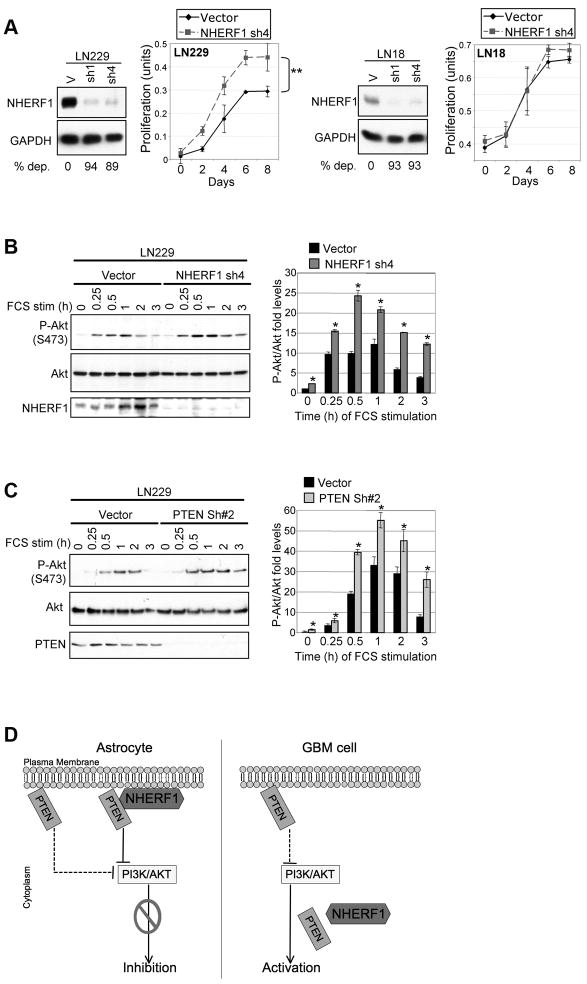
Figure 4.
Knockdown of membrane-localized NHERF1 increases proliferation and Akt activation. A. The % depletion (dep.) is indicated for knockdown NHERF1 levels normalized to GAPDH. The proliferation of vector-control and NHERF1-depelted cells were performed with two different NHERF1 shRNAs (sh4 shown) and repeated three times with similar results. Values are means±SEM from triplicates; **=p<0.01. B. Time course stimulation of NHERF1-depleted and control cells with 10% FBS. Mean±SEM P-Akt/Akt values from two experiments: *=(0.0047<p<0.032). C. Time course stimulation of PTEN-depleted and control cells as in (B). Mean±SEM P-Akt/Akt values calculated from three experiments: *=(0.0016<p<0.016). D. Model depicting NHERF1 regulation of PTEN in normal and transformed cells. The dotted line indicates less efficient Akt suppression by PTEN in the absence of membrane NHERF1.

