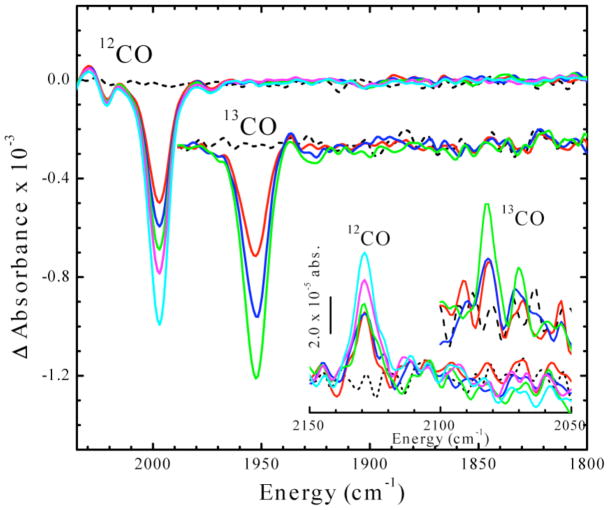
Figure 3.
Time dependence of IR absorbance changes upon photolysis of Ared-CO at 4.5 K. Inset: Development of features in the 2050–2150 cm−1 region, using 12CO and 13CO. See the Materials and Methods section for details of the FTIR experiment. Time points for 12CO data are: 0 (black), 3 (red), 6 (blue), 12 (green), 20 (magenta) and 40 (cyan) min. Time points for 13CO data are: 0 (black), 0.67 (red), 1.67 (blue) and 4 (green) min. The 13CO signal is enlarged 2.64-fold.

