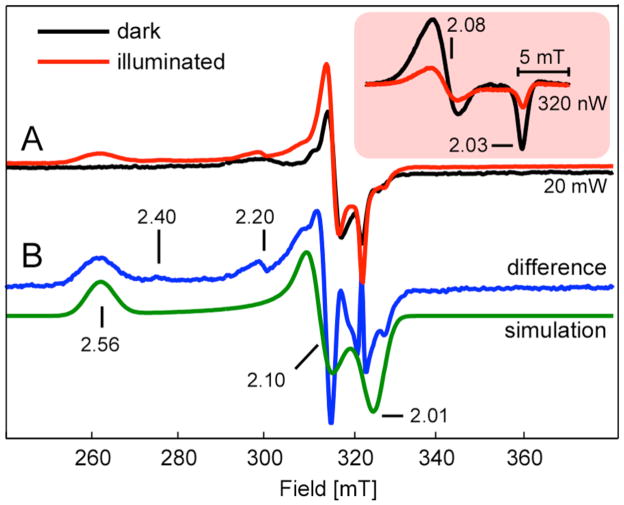
Figure 6.
EPR spectra of Ared* and Ared-CO
(A) 20 mW X-band EPR spectra of Ared-CO in 50 % glycerol (v/v) (black) and Ared-CO after one hour of photolysis at 4.7 K (red line). (Inset) NiFeC signal measured using 320 nW of microwave power (B) Difference of the two spectra in panel A (blue line) and corresponding simulation (green line). See text for spectrometer settings and full simulation parameters.

