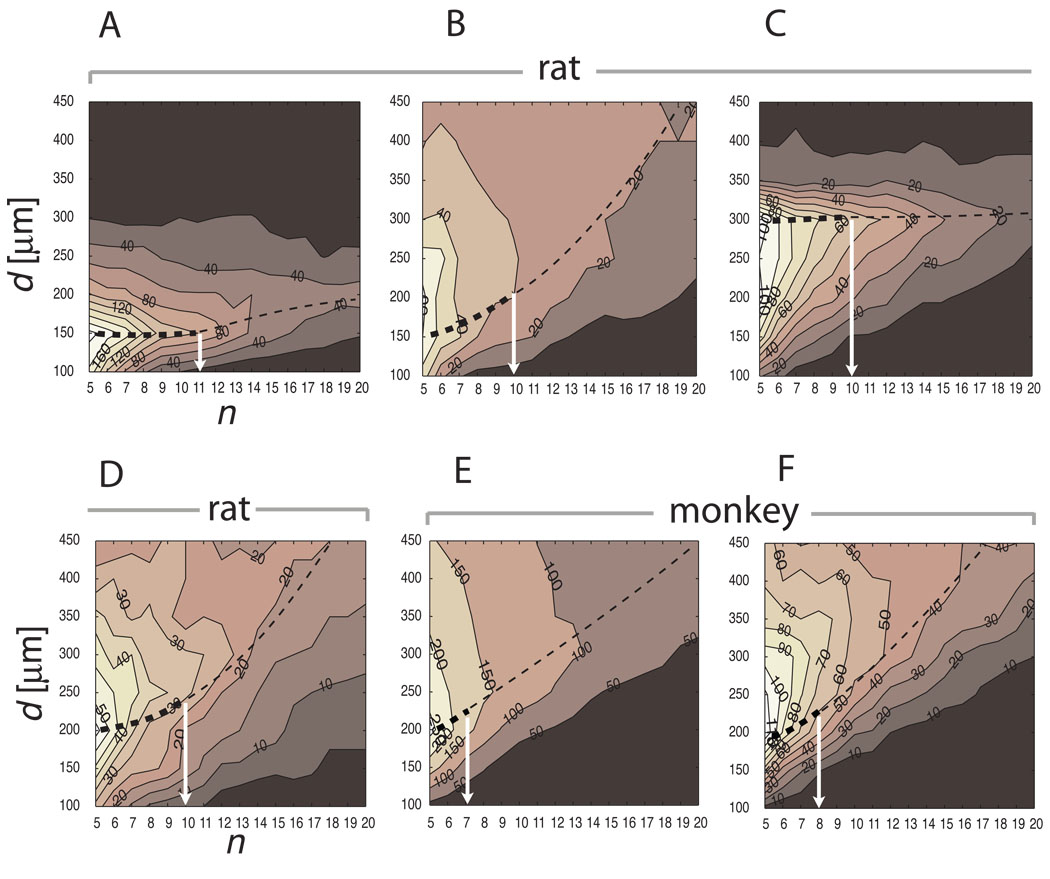
Figure 3.
The parameter space reveals the characteristic cluster size. The basal forebrain cholinergic system of four rats (A–D) and two monkeys (E–F) were mapped and an initial cluster parameter scan was performed on the 3D cell body distribution. Each histogram depicts the number of clusters c as a function of bubble diameter d (ordinate), and minimum number of nearest neighbors n (abscissa). As the predefined bubble size d increases from 100 µm the number of clusters also increases at a broad range of cell density n. However, the number of clusters starts decreasing beyond a critical bubble size d. The characteristic bubble diameter corresponds the maximum d (thin dashed lines) at which the number of clusters c forms a plateau (thick dashed line) within a range of n-s (white arrows). (A) rat #95124 d=150 n=11 c=22; (B) rat #96001R d=200 n=10 c=9; (C) rat #04012 (VRB) d=300 n=10 c=21; (D) rat #96002R d=200 n=10 c= 8; (E) monkey #1 d=200 n=7 c=26; (F) monkey #2 d=200 n=8 c=5.

