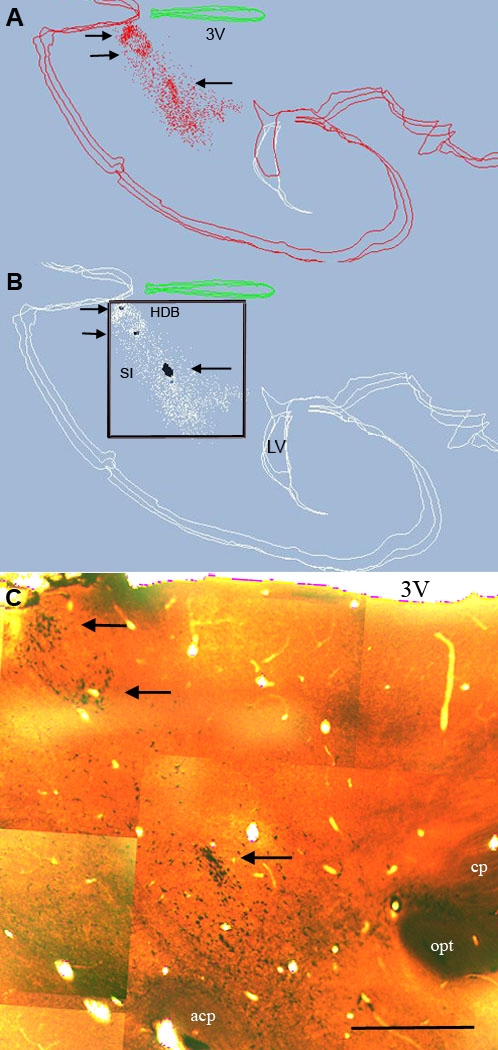
Figure 4.

Distribution of cholinergic cells (red) from three plotted sections (A) and clusters as identified in the cluster program (B). For clarity cholinergic cells forming seeds in (B) are labeled in black all other cholinergic cells shown in white. Case #95124, sections 7–9. (C) Montage from one of the sections to compare the computed clusters with the location of high density cell aggregates (arrows). acp= anterior commissure; cp= cerebral peduncle; opt=optic tract; 3V= third ventricle HDB= horizontal limb of the diagonal band; SI=substantia innominata; LV=lateral ventricle. Two parallel arrows point to clusters in the HDB. Single arrow points a large cluster in SI. Bar scale: 1 mm.
