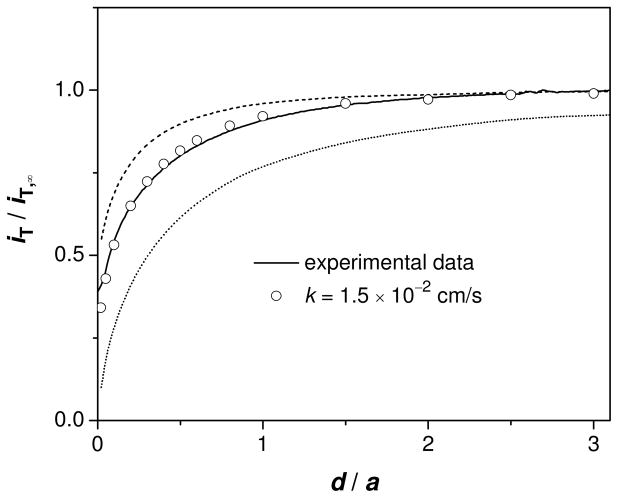
Figure 4.
SECM approach curve to the nanopore membrane for TBA+ in 0.1 M PBS (solid line). Probe scan rate, 0.3 μm/s. The circles represent the approach curve simulated with the k value that gives the best fit with the experimental curve. The dashed and dotted lines were simulated for freely permeable (kd = 4.2 × 10⁻² cm/s from eq 2 with l = 16 nm) and impermeable membranes, respectively. All simulated curves were obtained using (a, h/a, rg/a) = (1.7 μm, 0, 1.2).

