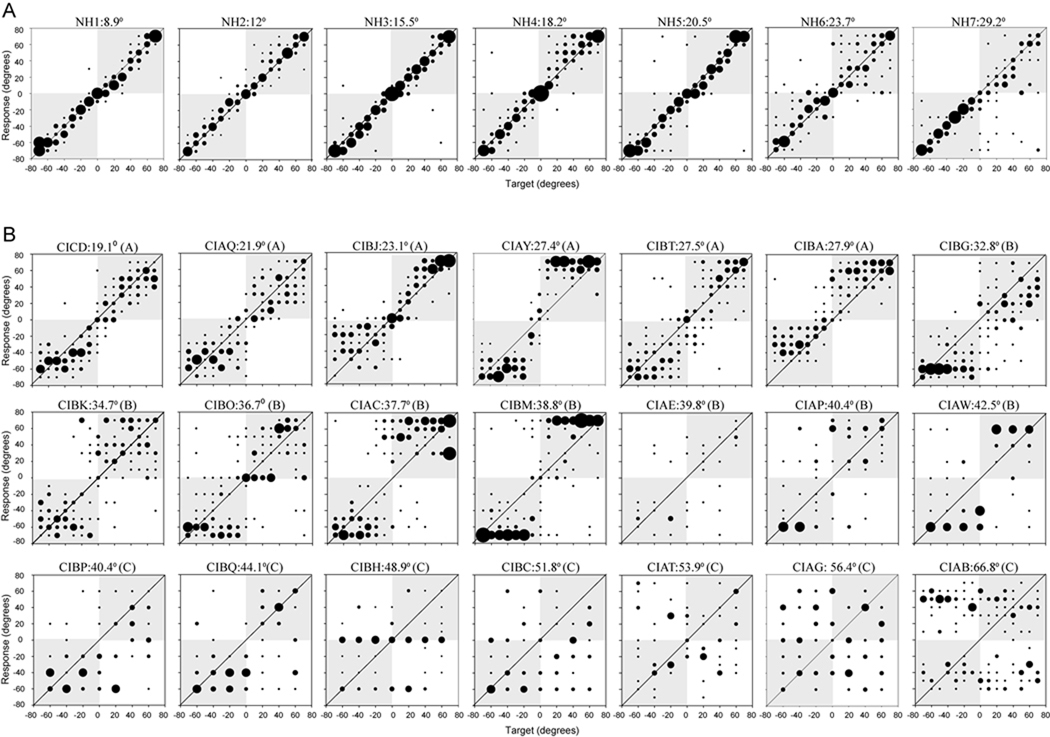
Figure 1.
Individual performance on the sound source identification task in the NH group (A) and the BICI group (B). The size of the dots represents the number of responses for a given target location. Larger dots reflect a greater number of responses. The diagonal line represents perfect performance. Letters in the parentheses indicate the subgroup that each child in the BICI group belongs to based on performance.

