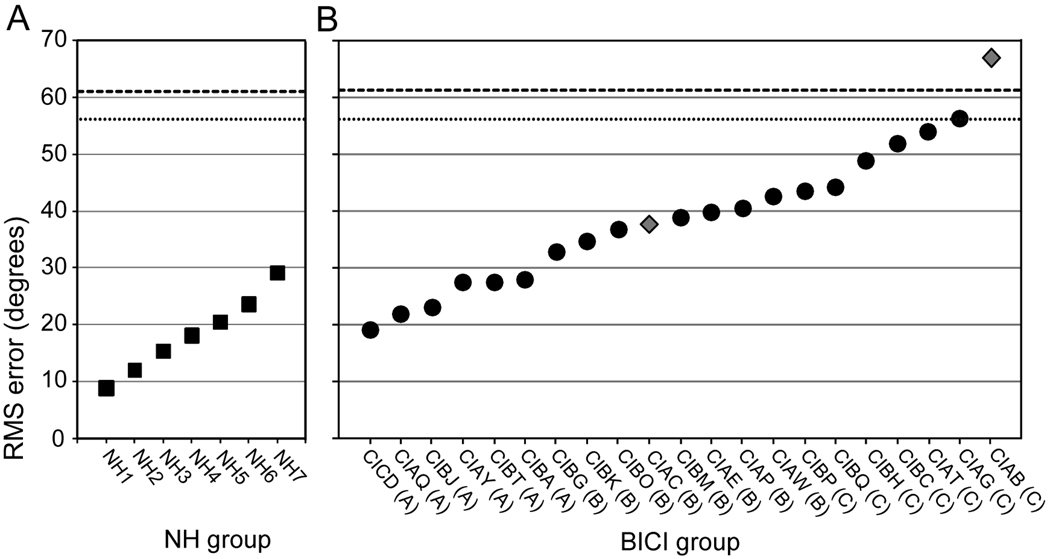
Figure 2.
Individual performance on the sound source identification task (as quantified by RMS error) for the NH group (A) and the BICI group when using both implants (B). In both panels, data are plotted along the x-axis from small RMS errors (better performance) to large RMS errors (i.e., poorer performance). Letters in the parentheses indicate the subgroup that each child in the BICI group belongs to based on performance. The gray diamonds represent the two children who were tested with the noise stimulus. The dotted line represents chance performance for the 7-AFC task and the dashed line represents chance performance for the 15-AFC task.

