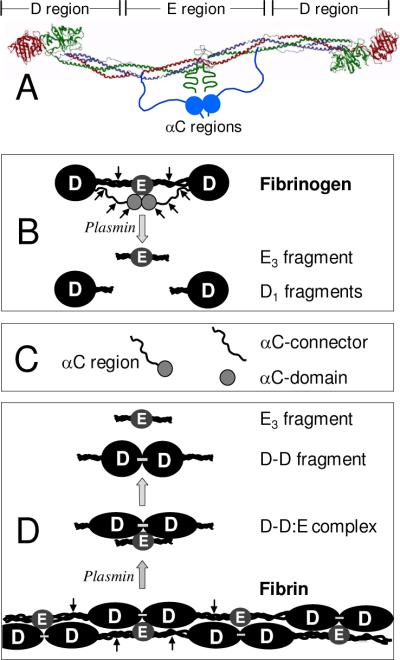
Fig. 1.
Schematic representation of fibrinogen, fibrin, and their fragments prepared for this study. Panel A: Ribbon diagram of fibrinogen based on its crystal structure (47); the individual fibrinogen chains, Aα, Bβ, and γ, are colored blue green, and red, respectively, the vertical lines denote approximate boundaries between the D and E regions. The αC regions, whose structure have not been identified, are shown schematically as two blue spheres representing αC-domains, each attached to the bulk of the molecule with the flexible αC-connector. Panel B: Schematic representation of the fibrinogen molecule and its products of plasminolysis, D1 and E3 fragments. Panel C: Recombinant αC region (Aα221–610 fragment), αC-connector (Aα221–391 fragment), and αC-domain (Aα392–610 fragment). Panel D: Schematic representation of fibrin and its products of fibrinolysis, the D-D:E complex, and the D-D and E3 fragments. For the sake of simplicity, only two strands of fibrin molecules without the αC regions are shown; the molecules are linked through the non-covalent DD:E interactions and covalent γ-γ cross-linking between the D regions (shown by small horizontal bars). Small arrows in panels B and D indicate plasmin cleavage resulting in fibrin(ogen) fragments.

