
Fig. 5.
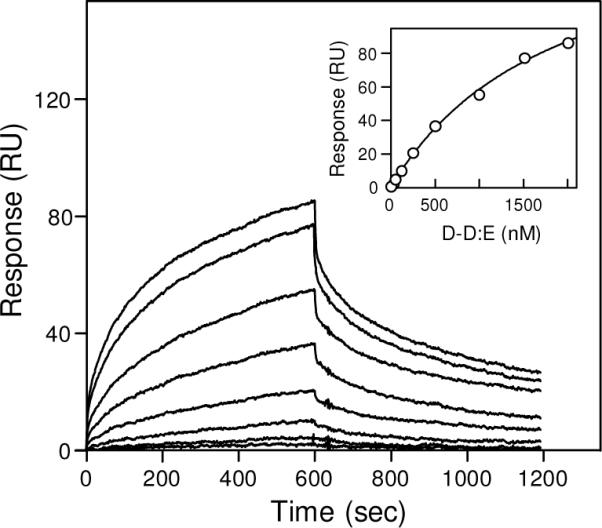
Analysis of the interaction between α2-antiplasmin and the D-D:E complex by surface plasmon resonance. The D-D:E complex at increasing concentrations, 32, 63, 125, 250, 500, 1000, 1500 and 2000 nM, was added to immobilized α2-AP and its association/dissociation was monitored in real time. The inset shows the results of the equilibrium analysis; the amount of bound D-D:E for each concentration is presented by circles and the best fit is presented by solid curve.