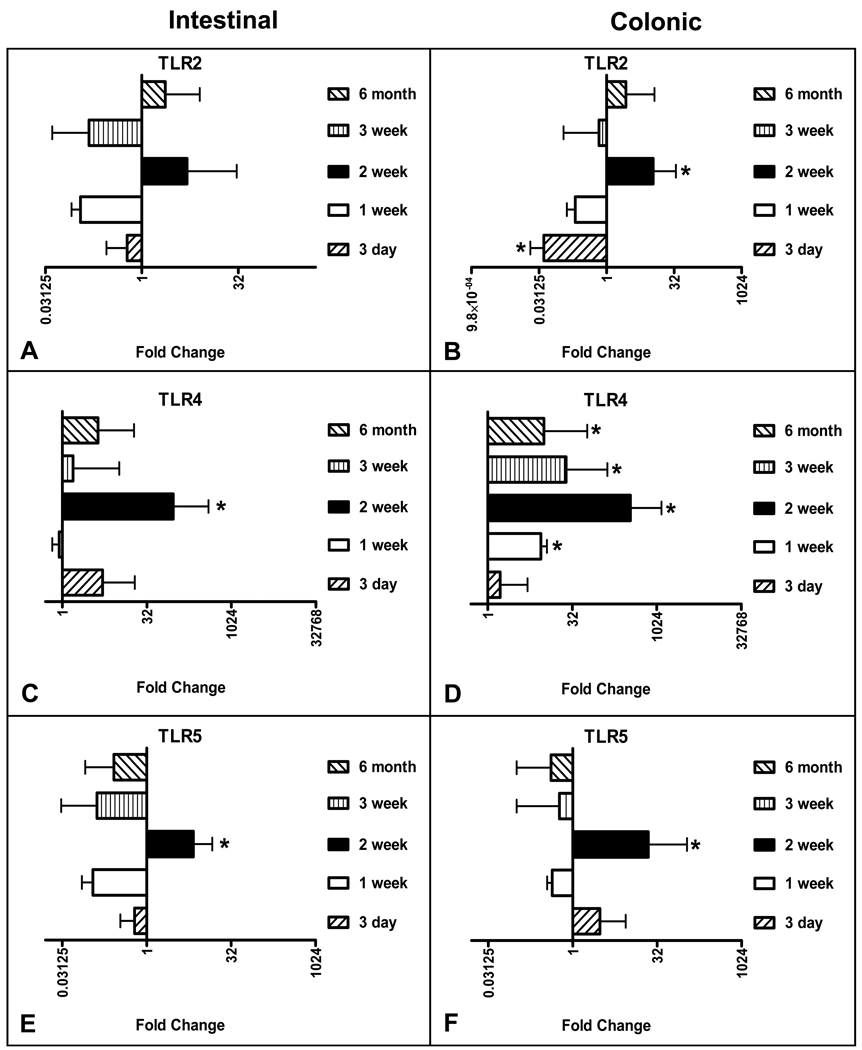
Figure 1.
Quantitative RT-PCR analysis of TLR gene expressin in SPF mice at various postnatal ages. (A) Small intestinal TLR2, (B) colonic TLR2, (C) small intestinal TLR4, (D) colonic TLR4, (E) small intestinal TLR5, (F) colonic TLR5. Data is expressed on a log2 scale and normalized to 18S rRNA expression, with fold change calculated by comparison with the level of expression in E20.5 mice. (E20.5 n=7, Day 3 n=8, Week 1 n=10, Week 2 n=13, Week 3 n=9, Week 6 n=7). The bar graph to the right represents increased expression and to the left decreased expression.

