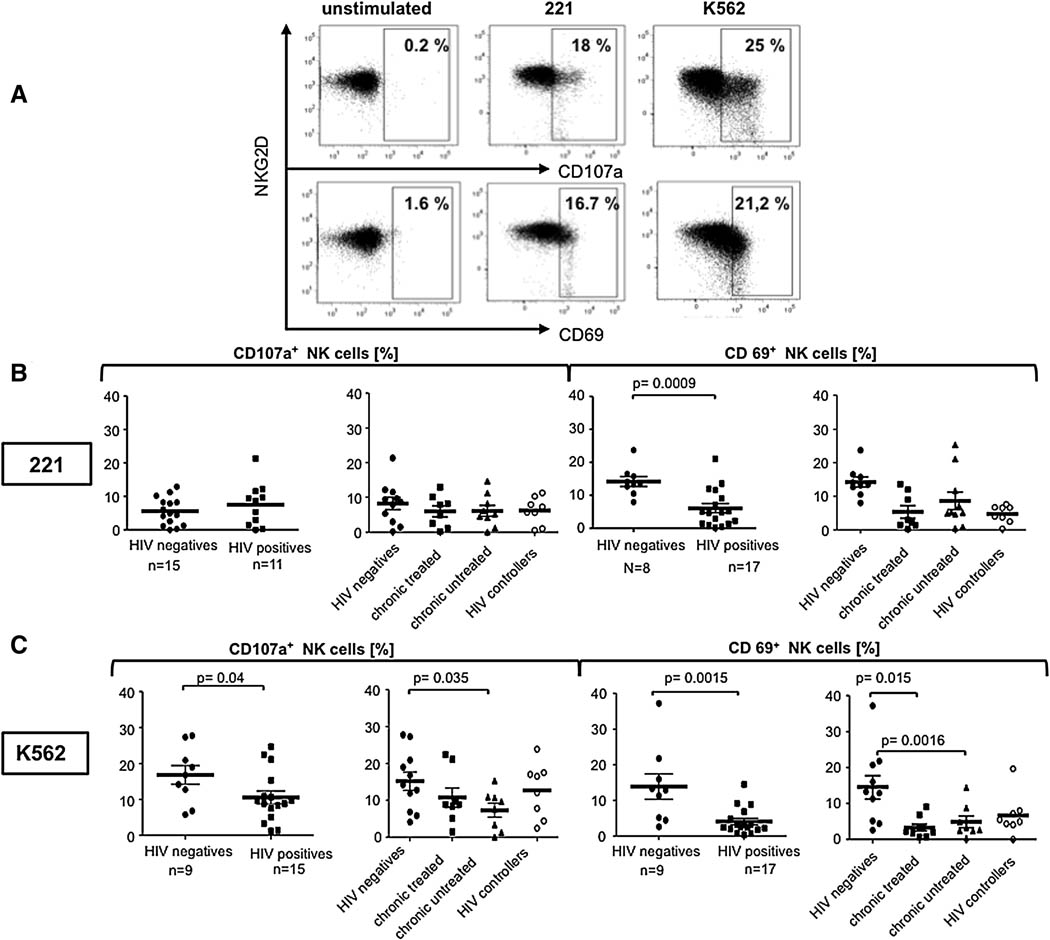
Figure 2. Reduced NKG2D- dependent degranulation and activation of NK cells in chronic untreated HIV-1 infection.
Flow plots (A) show representative raw flow cytometric data from a single individual measuring NK cell degranulation (CD107a expression) (top) and activation (CD69 expression)(bottom) following stimulation with 221 cells (middle) and K562 cells (right). The dot plot represents the overall NK cell degranulation (CD107a) and activation (CD69) of NK cells following stimulation with 221 cells (B) or K562 (C) cells in HIV- infected (squares) or uninfected individuals (circles). The dot plots represent the distribution of NK cell responses among the different patient subpopulations .

