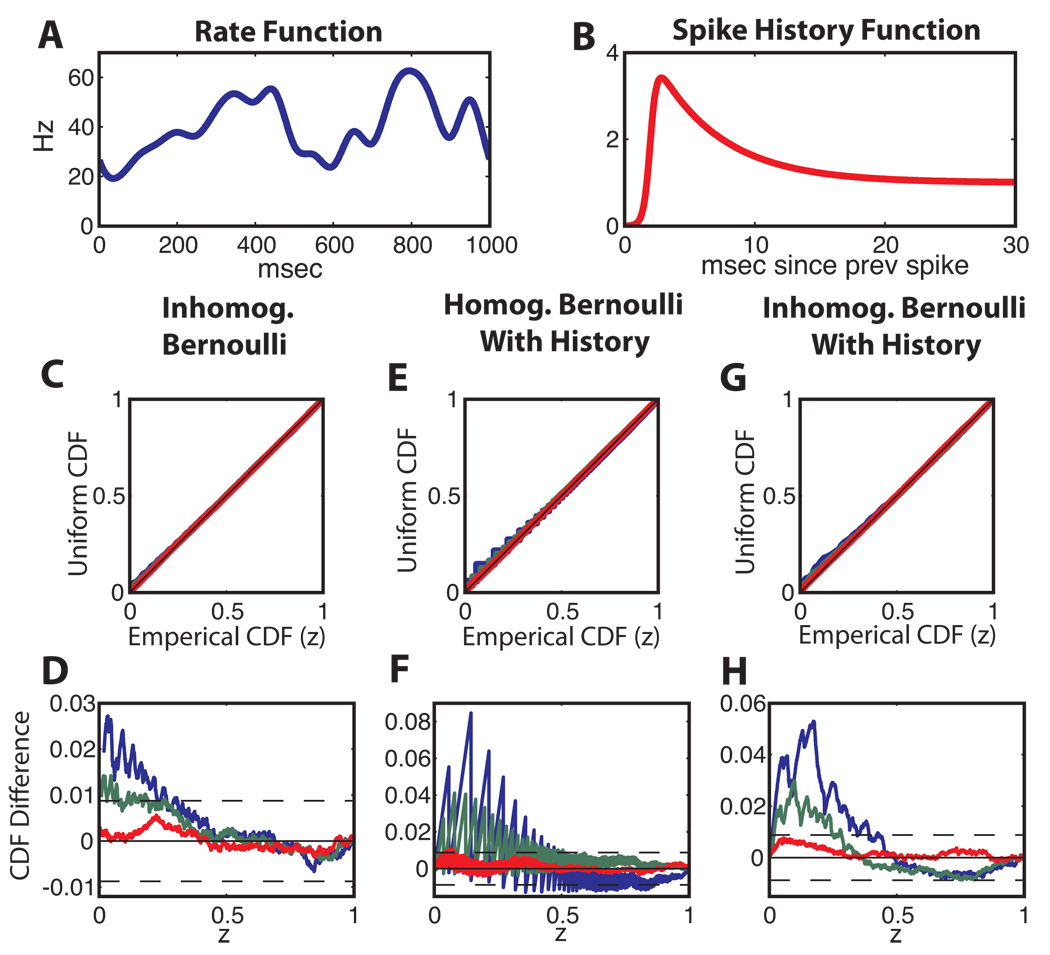
Figure 3.
KS and Differential KS plots for 10 minute long 40 Hz mean firing rate simulated spike trains. Three continuous time models of the conditional intensity function were used for simulation. 1) inhomogeneous Poisson process 2) homogeneous Poisson with a renewal spike history process 3) inhomogeneous Poisson with a renewal spike history process. (See text) The continuously defined processes were discretized at various values Δ and used to simulate spikes. (A) 40 Hz mean inhomogeneous Bernoulli firing rate. (B) Spike history term λhist as a function of time since the most recent spike. (C) and (D) KS and Differential KS plots for inhomogeneous Bernoulli process. Blue: Δ = 1 msec, green: Δ = 0.5 msec, red: Δ = 0.1 msec. Horizontal dashed lines are 95% confidence bounds. (E) and (F) Homogeneous Bernoulli process with spike renewal history term. (G) and (H) Inhomogeneous Bernoulli process with spike renewal history term. Note that when spike history effects are present the biases are larger both at short and long rescaled ISIs.

