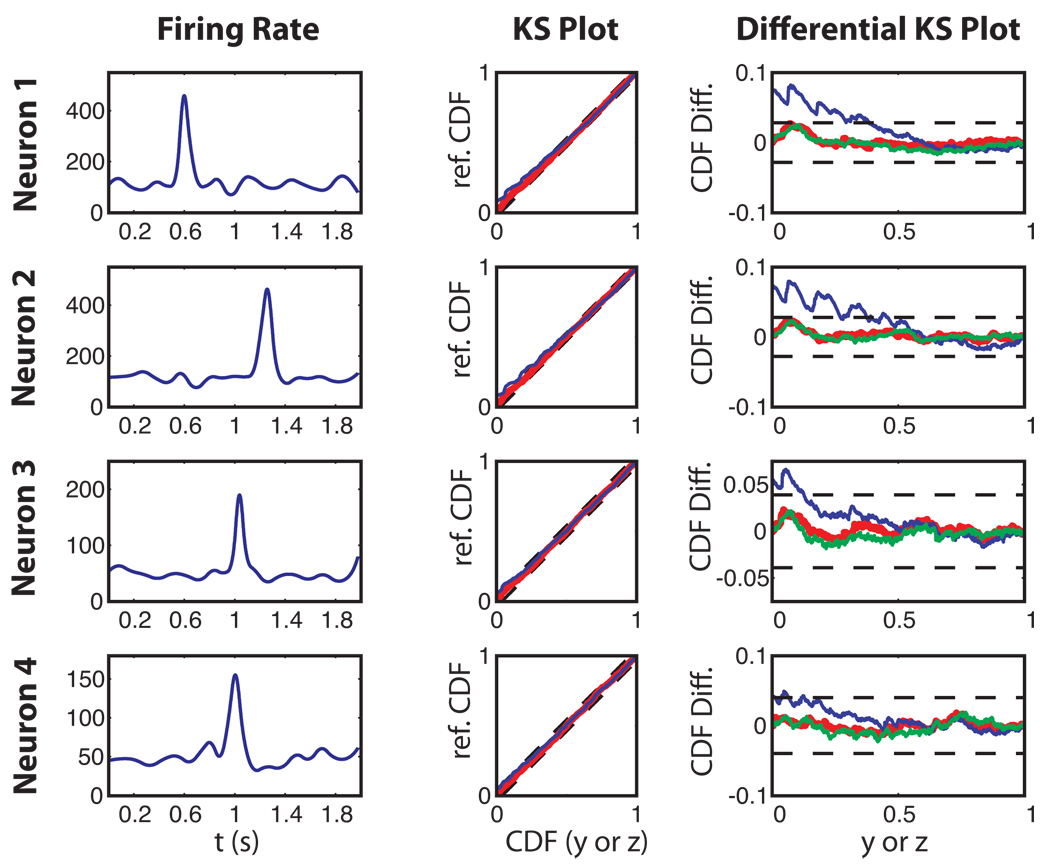
Figure 5.
Four examples of neurons from two different monkeys (top two rows: monkey 1, bottom two rows: monkey 2) for which goodness of fit appears to be poor when the standard KS test is used but revealed to be good when either the numerically estimated reference distribution or the analytically corrected rescaled time y are used. First Column: firing rate, second column: KS plot, third column: Differential KS plots. Blue: standard KS test. Red: KS test with numerical simulation of reference distribution. Green: KS test with analytically corrected rescaled time y. As with the simulated spike trains of Figure 4, the KS and Differential KS plot biases are eliminated when either the rescaled ISI distribution (z) is simulated using the fitted model, or the analytically corrected rescaled time y is used.

