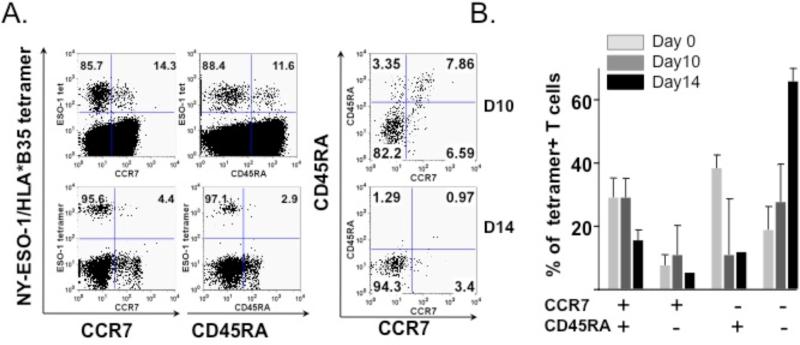
Figure 5. Longer culture time leads to expansion of the CD8+ CCR7-CD45RA- subset.
Multiparameter flow cytometry with the markers CCR7 and CD45RA was performed to analyze the phenotype of tetramer-positive CD3+CD8+ cells after 10 and 14 days of in vitro culture. (A) A representative dot plot indicates an increase in the population of CCR7-CD45RA- NY-ESO-1 tetramer-positive CD3+CD8+ T cells between Days 10 and 14 of in vitro culture. (B) This chart represents an average of CCR7/CD45RA subsets for fluMP, Melan-A and NY-ESO-1 tetramer-positive CD3+CD8+ T cells at Day 0, 10 and 14 of in vitro culture. The proportion of CCR7-CD45RA- cells increases with the length of culture time.

