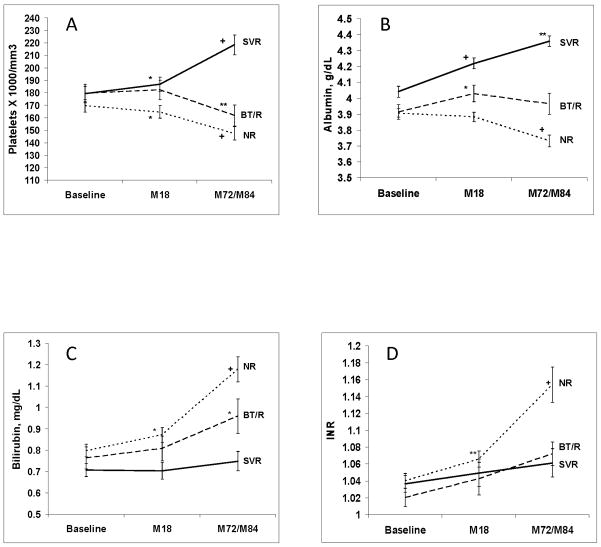
Figure 3.
Mean (± standard error of the mean) value of laboratory tests at baseline, Month 18, and Month 72/84 for patients with SVR, BT/R and NR. (a) platelet count (× 1,000/mm3) (n=100 (SVR), 54 (BT/R) and 181 (NR)), (b) serum albumin (g/dL) (n=102 (SVR), 54 (BT/R) and 184 (NR)), (c) serum total bilirubin (mg/dL) (n=102 (SVR), 54 (BT/R) and 184 (NR)), and (d) INR (n=85 (SVR), 54 (BT/R) and 179 (NR)). Statistical comparisons within each group are between two adjacent time points (i.e., baseline vs. M18 and M18 vs. M72/84). *p<0.05; **p<0.001; +p<0.0001.

