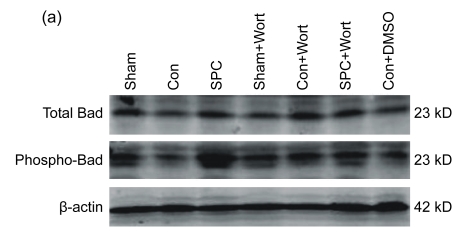
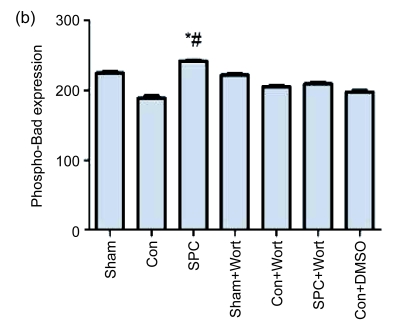
Fig. 6.
Western blot analysis of total Bad and phospho-Bad
(a) Western blotting analysis of total Bad and phospho-Bad at Ser136. β-actin was used to demonstrate equal protein loading; (b) Graphic presentation of phospho-Bad normalized against total Bad expression. Values are expressed as mean±SEM. * P<0.05 compared with the Con group; # P<0.05 compared with the SPC+Wort group


