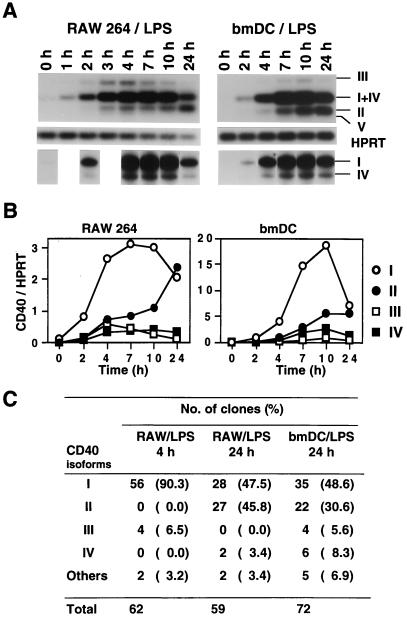
Figure 4.
Differential expression of CD40 isoform mRNAs. (A) CD40 isoforms type I–V (III, I+IV, II, and V) and HPRT were analyzed by RT-PCR using cytoplasmic RNAs from LPS-activated RAW 264 and bmDC. To separate PCR products from type I and IV (5 nt smaller than type I) RNAs, cDNAs were amplified by using P6 and 32P-labeled P5 primers (Fig. 1A). The PCR products then were analyzed on 6% sequence gel and are shown below the HPRT results. Cytoplasmic RNAs were isolated at different time points after LPS activation, as indicated. (B) RT-PCR shown in Fig. 4A was analyzed also by using a PhosphorImager. Intensity of type I (○), type II (●), type III (▫), and type IV (▪) bands are indicated. Type V was not detected in bmDC or RAW 264 cells (3 and 4 h LPS-activated RAW 264 cells might express very small amounts of type V). Population of type I and IV was calculated by using the results analyzed by sequence gel. Expression levels were normalized to HPRT levels. (C) Population assay (see text and Fig. 1D) of CD40 isoform mRNAs from indicated cells.

