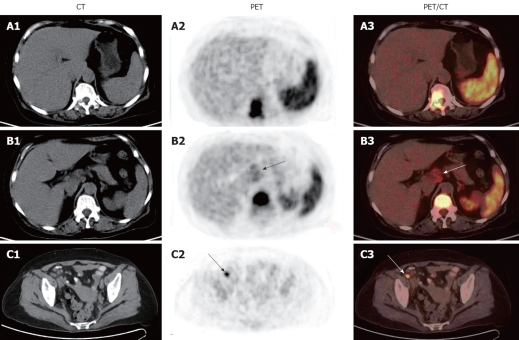
Figure 3.
18F-fluorodeoxyglucose positron emission/computed tomography images of patient 2 showing diffuse intense uptake of 18F-fluorodeoxyglucose in spleen and intense 18F-fluorodeoxyglucose uptake in thoracic vertebrae (A1-A3), a mass-like area with an intense 18F-fluorodeoxyglucose uptake in hepatic hilar region (arrows) and thoracic vertebrae (B1-B3), and a focal intense uptake of 18F-fluorodeoxyglucose in right iliac arterial region (arrows) (C1-C3). CT: Computed tomography; PET: Positron emission tomography.

