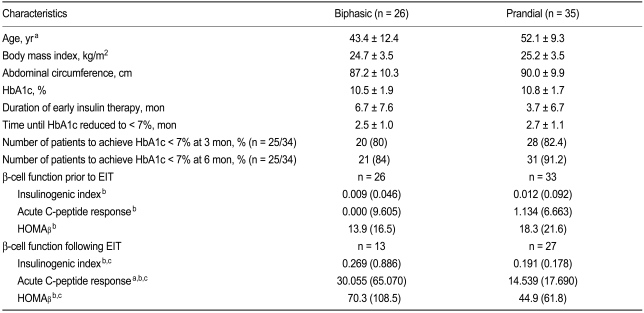
Table 2.
Comparison of biphasic and prandial group characteristics
Values are presented as mean ± SD unless otherwise indicated.
EIT, early insulin therapy; HOMA, homeostasis model assessment.
aComparison between the biphasic and prandial groups, p < 0.05.
bValues are presented as the median (interquartile range).
cComparison between values pre- and post-EIT treatment, p < 0.001.

