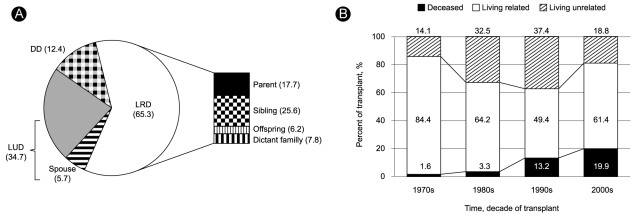
Figure 1.
The proportion of each donor type and subtype by total transplant numbers. (A) The living related donor (LRD) group comprised more than half of all transplants. Within this group, sibling donors were most common, followed by parental donors. Numbers in parenthesis indicate the percentage of each subgroup of the total cases. (B) Decadal changes in the proportion of each donor type. The LRD proportion decreased gradually, but the DD proportion increased gradually during the follow-up period. LUD, living unrelated donor; DD, deceased donor.

