
Figure 1.
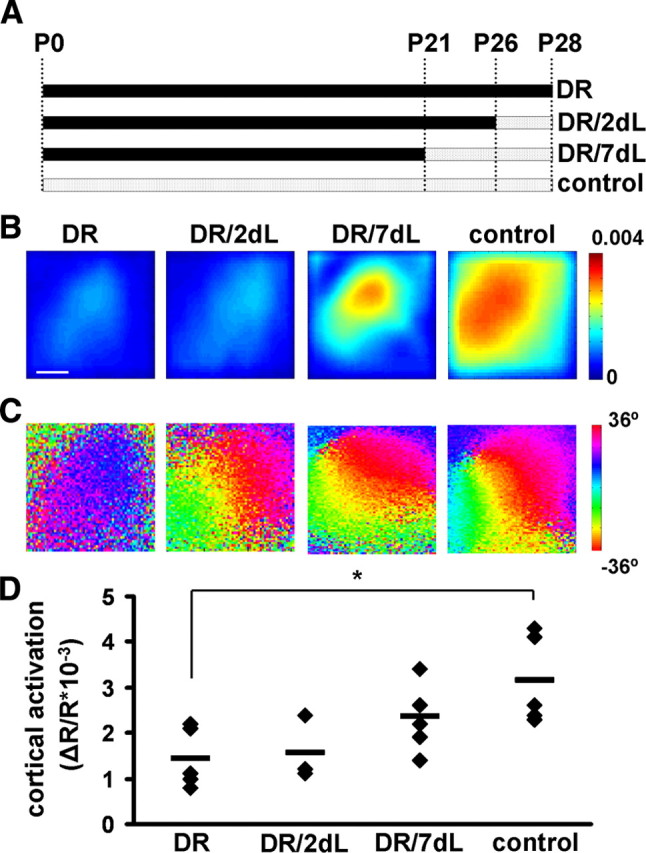
Visual experience regulates cortical responses to vision. A, Time course of the experiment: all animals were imaged at P28. The period of dark rearing is represented as a black line, while the white-dotted pattern represents the period of exposure to a normal light environment. DR animals were maintained and anesthetized before imaging in complete darkness. DR/2 dl animals were dark-reared until P26 and then exposed to light. DR/7 dl animals were dark-reared until P21 and then exposed to light. Control animals were reared in a normal 12 h light/12 h dark environment. B, Representative images of the cortical intrinsic signal in response to a visual stimulus in individual mice from the different groups imaged. Red hues indicate strong activation, according to color key at right depicting the change in reflectance, dR/R. In dark-reared mice, cortical activity in response to light is low and increases as mice are exposed to light. Scale bar, 0.5 mm. C, Representative retinotopic maps of visual field elevation in individual mice with different visual experience. The map is highly disorganized in dark-reared animals and the level of organization progressively increases together with the duration of light exposure. Color key at right depicts visual elevation. D, Quantification of the visually evoked optical signal across animals with different visual experience. The strength of the signal (normalized change in reflectance, dR/R) is low in dark-reared animals and recovers with longer light exposure. *p < 0.05 when compared with control.