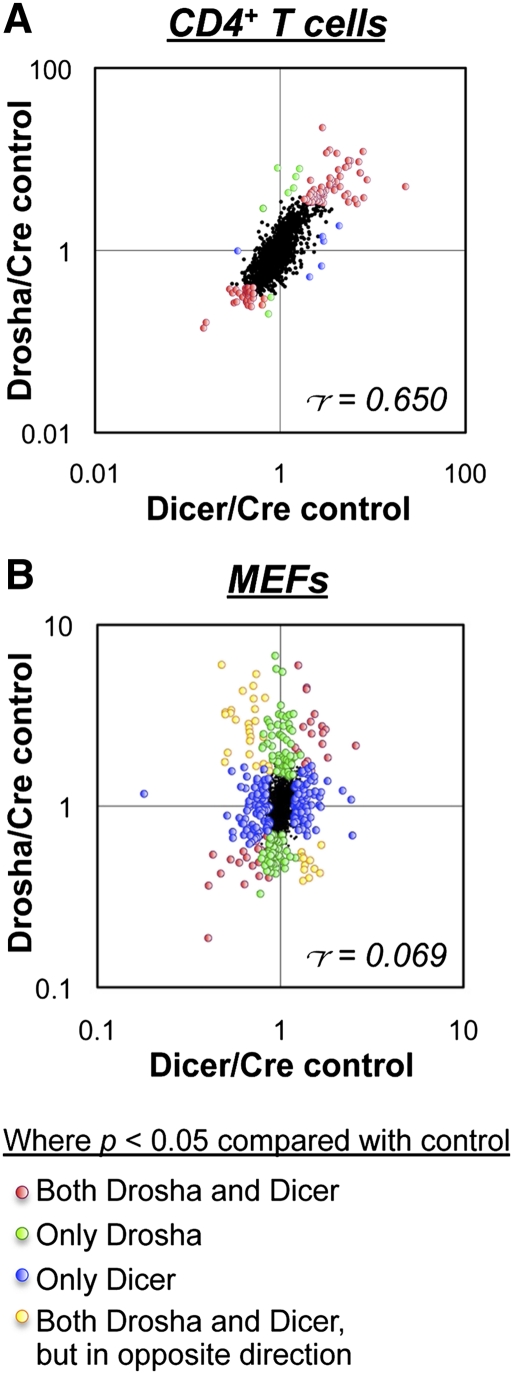
Figure 3.
Impact of Drosha and Dicer deficiencies on the proteome. Shown are ratios of individual protein expression levels in in vitro activated CD4+ T cells (A) and MEFs (B) as determined by SILAC analysis. Drosha-deficient cells were cultured in L-Lys/L-Arg-deficient medium supplemented with the light isotopes L-Lys 12C614N2 and L-Arg 12C614N4, Dicer-deficient cells were cultured in medium supplemented with the intermediate isotopes L-Lys 4,4,5,5-D4 and L-Arg 13C614N4, and control cells were cultured in medium supplemented with the heavy isotopes L-Lys 13C615N2 and L-Arg 13C615N4. The labels were then inverted for repeat experiments. Labeling was performed for at least five cell divisions to label all proteins before analysis by quantitative mass spectrometry. In CD4+ T cells, deletion was achieved with CD4-cre, and in MEFs, deletion was achieved with Gt(Rosa)26SorCreER. Only data for proteins that were quantified in all three genotypes are shown. Indicated are the proteins that were found to be significantly different (P < 0.05 by ANOVA) in Drosha- and/or Dicer-deficient cells compared with controls. r = Pearson's correlation coefficient.

