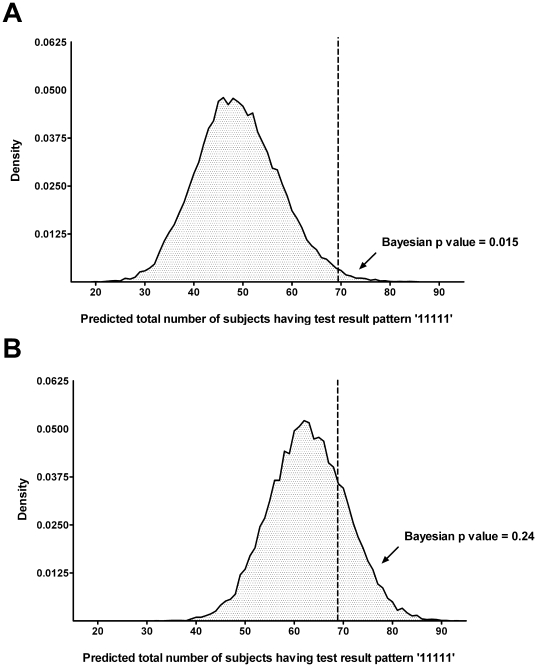
Figure 1. Assessing the fitness of model 0 (conditional independence model) (A) and the final model (conditional dependence model) (B) using probability analysis (posterior predictive distribution).
Dataset was replicated for 20,000 times per model to assess the probability that the actual dataset was being observed, if that model was true. Running model 0 a total of 20,000 times (Figure 1A), we found that only 298 replicate datasets had at least 69 patients with all five tests positive and giving the profile ‘11111’ (69 was the number of patients having this profile in the actual dataset) (298/20,000, Bayesian p value 0.015). This indicated that model 0 was not a good fit for the observed data. Running the final model a total of 20,000 times (Figure 1B), we found that 4,752 replicate datasets had at least 69 patients with the profile ‘11111’ (4,752/20,000, Bayesian p value 0.24), indicating that the final model fit the observed data well.

