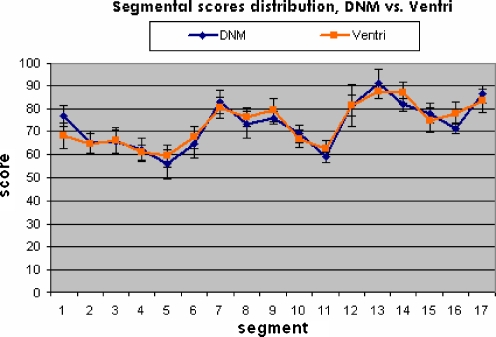
Fig. 10.
Distribution of segmental scores for a series of ten uniform phantoms acquired under conditions mimicking low-dose rest acquisition. Blue: DNM short acquisition time. Orange: S-SPECT (Ventri) with longer acquisition time. Error bars represent two standard deviation values showing variability within corresponding series. Most segments show comparable mean scores and the differences between the scores of the two modalities are similar to their intrinsic variability

