
Figure 2.
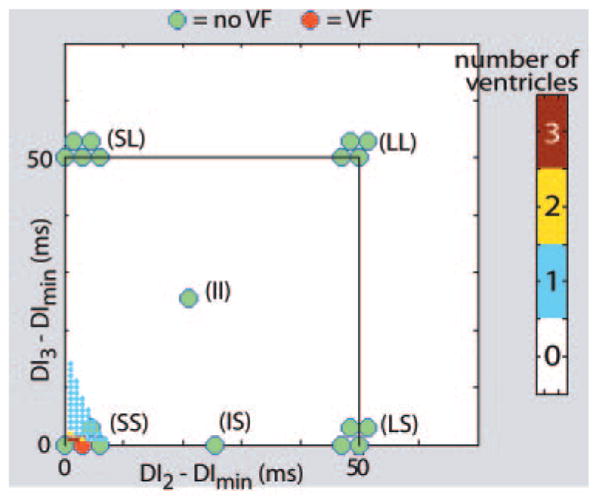
Induction of VF with 2 premature stimuli: theoretical predictions and experimental results. The small, color-coded dots show the number of ventricles (of 5) in which all possible combinations of 2 premature stimuli were predicted to induce conduction block. The location of each dot defines a specific combination of premature stimuli through the coordinates of the dot, DI2 and DI3, relative to DImin. The color of the dot designates the number of ventricles predicted to exhibit conduction block (see color bar, right) for that combination of premature stimuli. Note that conduction block was predicted to occur only for short-short (SS) sequences (all of the dots outside the SS region are white). In addition, even for SS intervals, only a few combinations were predicted to cause block in >1 ventricle (most of the dots in the SS region are blue). The color-coded disks show ventricles in which VF could (red) or could not (green) be induced experimentally with combinations of premature stimuli from various stimulus combination categories (made from short [S], intermediate [I], and long (L) intervals). The disks are clustered into groups, with each cluster labeled as 1 category (eg, SS, LS). Each disk within a cluster represents a ventricle that was subjected to a sequence of stimuli from that particular category. Note that, as predicted, all premature stimulus combinations other than SS failed to induce VF. Moreover, an SS combination induced VF in only 1 ventricle (of 4 tried), in good agreement with the theoretical predictions.