
Figure 4.
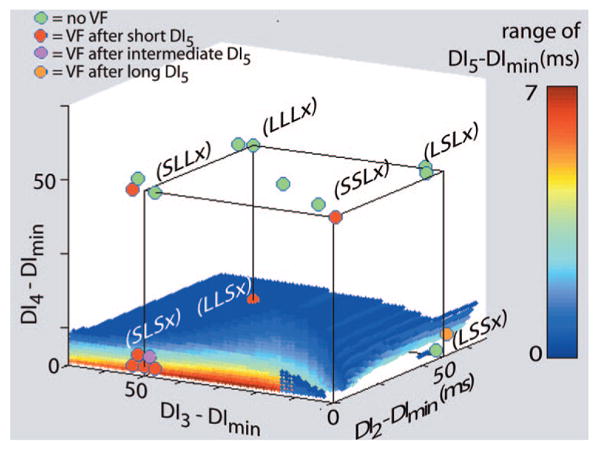
Induction of VF with 4 premature stimuli: theoretical predictions and experimental results. The meaning of symbols in this plot is different from Figures 2 and 3. The small, color-coded dots show the range of DI5 above DImin for the fourth premature stimulus that is predicted to produce conduction block for various combinations of the first 3 premature stimuli. (Again, what appears to be a surface is actually composed of colored dots.) Each cluster of color-coded disks represents the 3 stimulus combination categories that have the same designation (ie, S, I, or L) for the first 3 premature stimuli and any one of S, I, or L as the designation for the fourth premature stimulus (x). The color of each disk indicates whether no combination of premature stimuli was able to induce VF (green) or whether a combination from the stimulus category with a short (S), intermediate (I), or long (L) fourth premature stimulus was able to induce VF (red, maroon, or orange, respectively). Note that 7 of 9 VF inductions were predicted by the theory and that, when conduction block was predicted, VF induction occurred in all cases except 1 (green disk at LSSx).