
Figure 5.
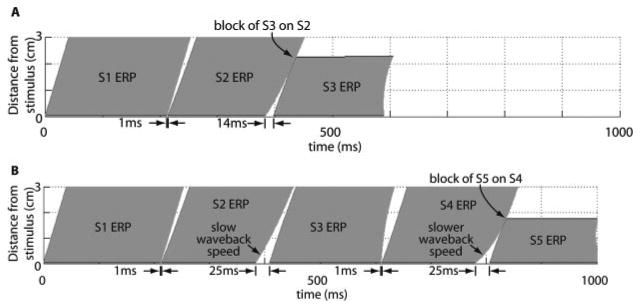
A, Plot of the ERPs of S1, S2, and S3 when the S2 stimulus is delivered 1 ms after the S1 ERP and the S3 stimulus is delivered 14 ms after the S2 ERP. This S2S3 interval is the largest such interval that produces block of the S3 wave (ie, if S3 is delivered 15 ms after the S2 ERP, block of S3 does not occur). B, S1 through S5 ERPs as functions of time and distance for S2 through S5 stimuli delivered 1, 25, 1, and 25 ms above ERP.