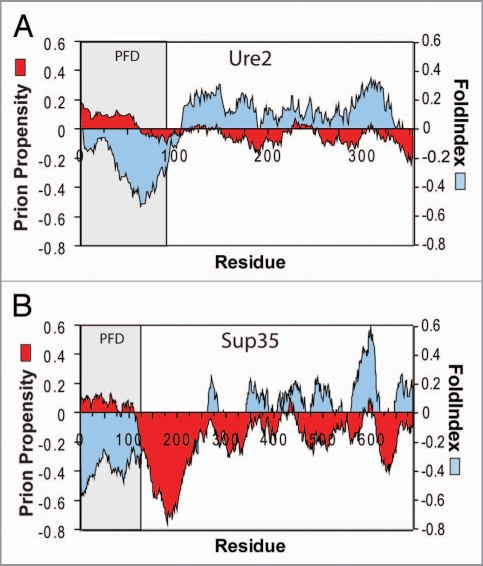
Figure 2.
Prion propensity maps. Ure2p (A) and Sup35 (B) were scanned using a window size of 41 amino acids, calculating for each window the average order propensity using FoldIndex and prion propensity as the sum of the experimentally determined prion propensities for each amino acid across the window. The prion domain (PFD) is shaded.

