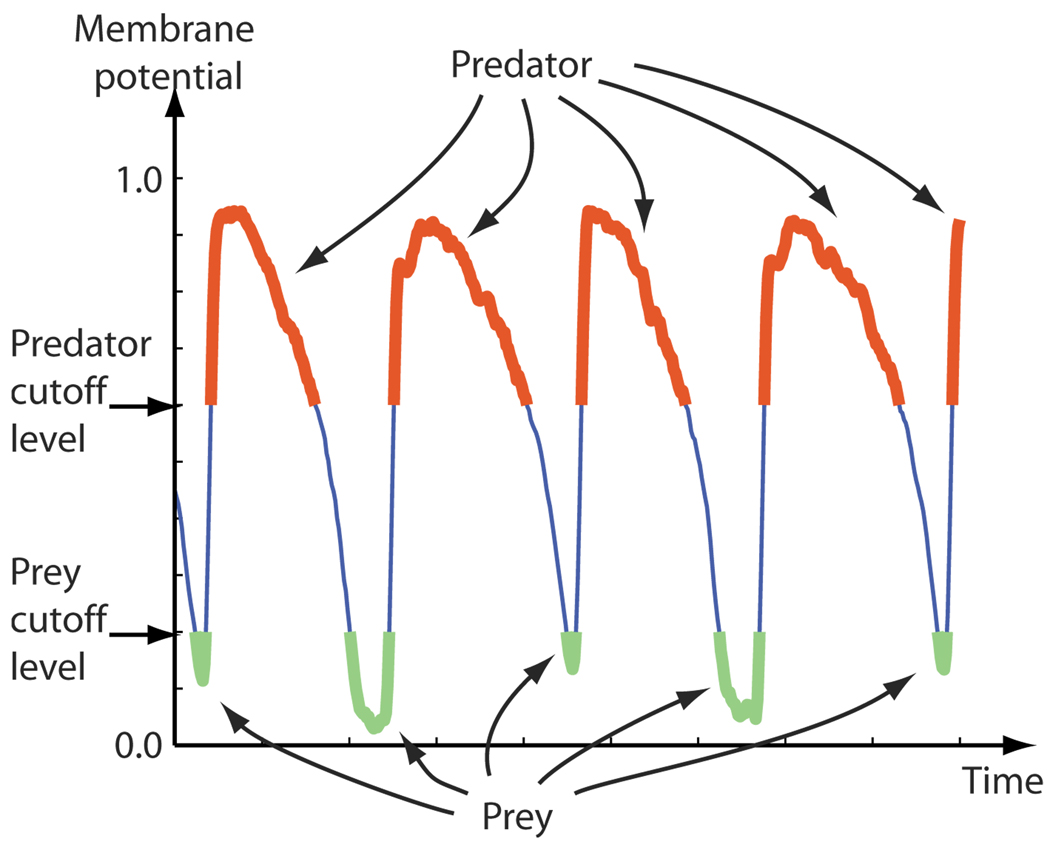
FIG. 1.
(Color online) Definitions of the predator and prey states as applied to the time record of a single pixel taken from typical filtered optical mapping data. The pixel was considered to be in the predator or prey state when the optical signal, assumed to represent the membrane potential, was above or below fixed cutoff levels. Here the data were normalized and inverted so that 0.0 and 1.0 represented the minimum and maximum observed membrane potentials, respectively, for the given pixel. The predator and prey quantities D(t) and Y(t), at any given time t, were then defined to be the fraction of cells in the predator and prey states at time t.

