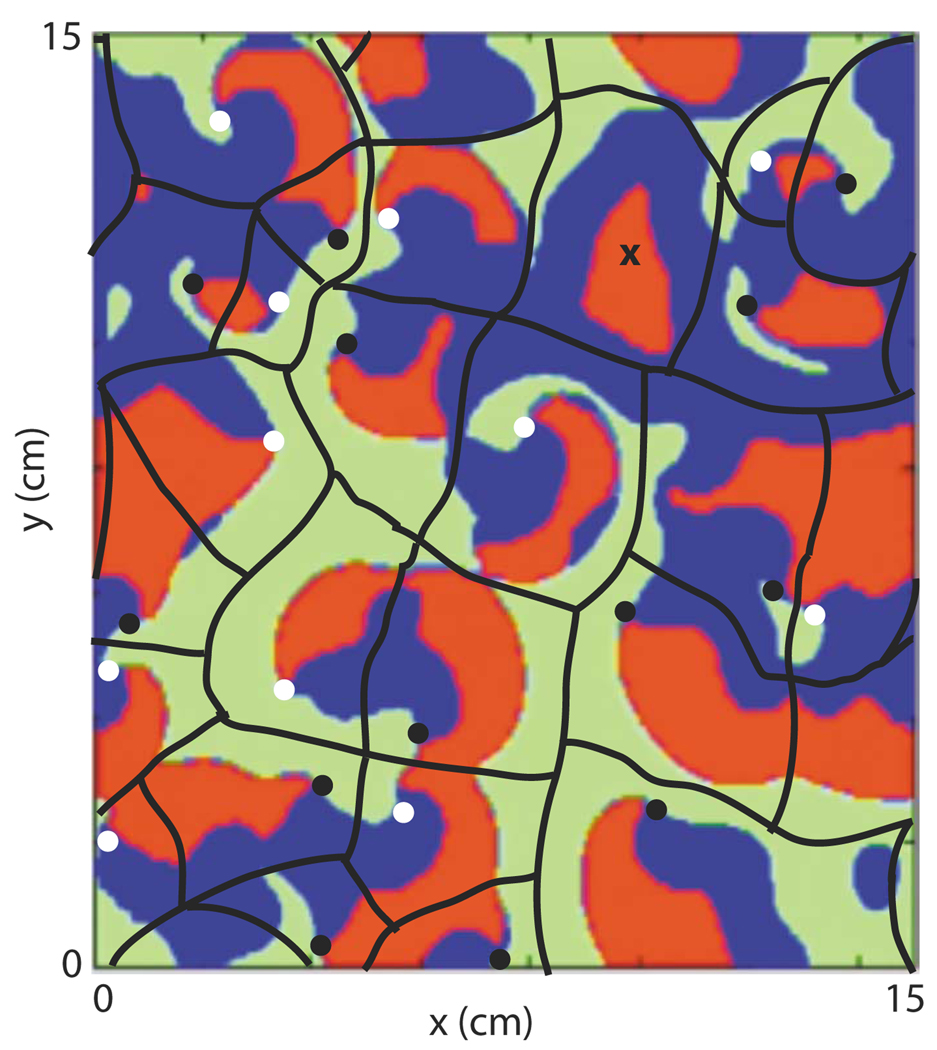
FIG. 12.
(Color online) An example of how the domains of influence might be drawn for a particular pattern of action potential propagation. The background color image is a snapshot of a large (15 cm × 15 cm) 3V-SIM simulation () taken during type-2 behavior. Red = predator (action potential) regions; green = prey regions; blue = neither predator nor prey. Black and white dots mark spiral wave tips rotating in the clockwise and counterclockwise directions, respectively. The black lines mark the boundaries of the domains of influence. Domains located near the edges of the system continue through the periodic boundaries to the opposite side of the system. Note that each domain contains exactly one spiral wave, except the one marked with the “X” which contained two spiral waves until they annihilated one another shortly before the time of this snapshot. The boundaries drawn are not definitive, but rather represent the authors’ best guess of an average of where the adjacent spiral waves had collided, will collide, and/or would have collided had not breakup or some other disrupting event occurred.

