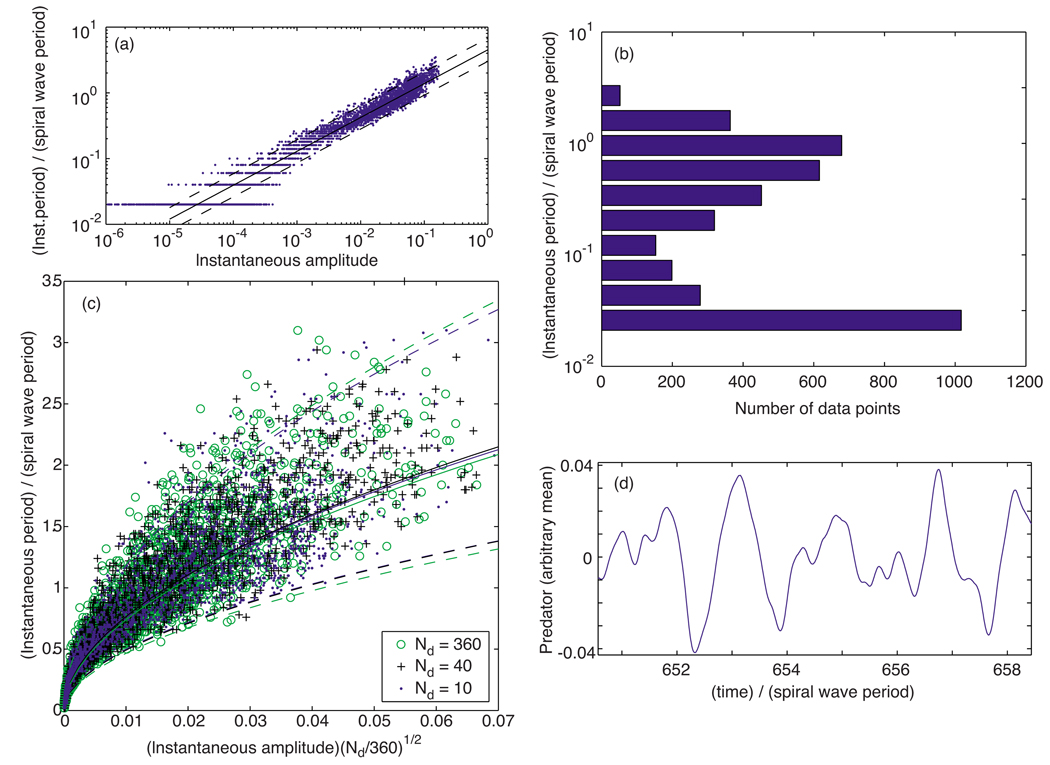
FIG. 16.
(Color online) Data from a simple domain-based model. (a) Instantaneous periods T relative to the spiral wave period plotted vs the corresponding amplitudes A of the predator quantity for Nd = 30. Calculated least-squares slope: 0.515. (b) Distribution of data vs the instantaneous period (relative to the spiral wave period, logarithmic binning) for the same model run as in (a). (c) Instantaneous period T vs instantaneous amplitude A of the predator quantity multiplied by the square root of Nd for three different values of Nd: Nd = 10 (blue dots), 40 (black “+’s”), and 360 (green circles). The log-log fit least-squares slopes were found to be 0.534, 0.531, and 0.523, respectively. (d) Typical behavior of the global predator quantity as a function of time t taken from the Nd = 30 run. In both (a) and (c), the solid lines depict the least-squares fit; the dashed lines mark unit standard deviation departures from each fit.

