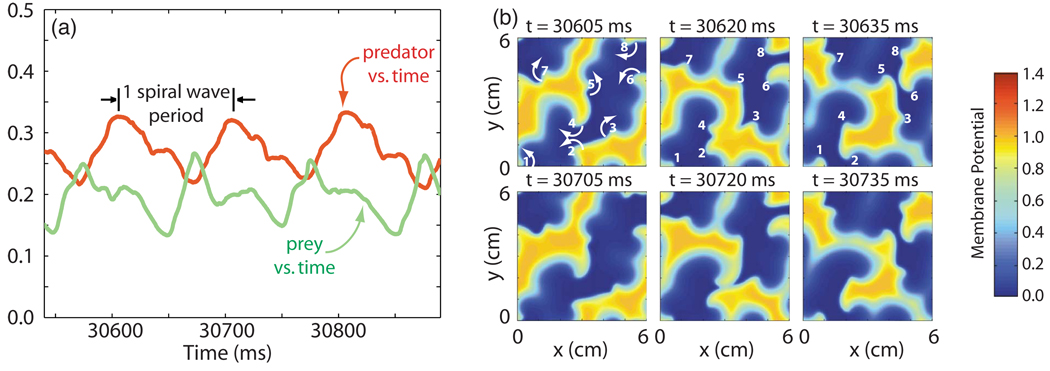
FIG. 2.
(Color online) (a) Predator and prey quantities [D(t) and Y(t)] vs time during type-1 behavior in the 3V-SIM system. The spiral wave period (101 ms) is shown for reference. (b) Snapshots of the membrane potential (resting state = 0, activated state ≈ 1) in space taken at various times during the time interval shown in (a). The first frame also shows the sense of rotation of the tips of the eight spiral waves present. All three frames in the first row illustrate these rotations by marking the locations of the eight spiral wave tips (identified by the numbers 1–8). Frames in the second row, which are taken 100 ms, or almost exactly one spiral wave period (= 101 ms), later than those in the first row, show the continued, nearly identical pattern of rotation of these eight spiral waves.

