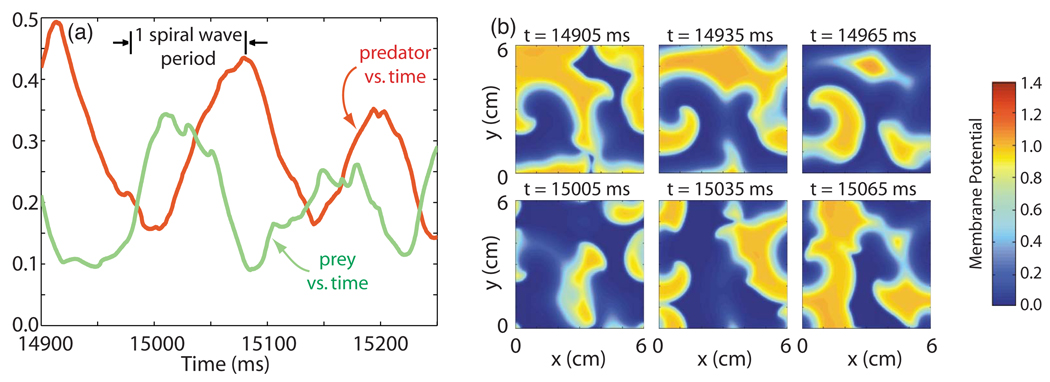
FIG. 3.
(Color online) (a) Predator and prey quantities [D(t) and Y(t)] vs time during type-2 behavior in the 3V-SIM system. The time interval used is equal in duration to that used in Fig. 2(a), to allow direct comparison. The spiral wave period (101 ms) is shown for reference. (b) Snapshots of the membrane potential (resting state = 0, activated state ≈ 1) in space taken at various times during the time interval shown in (a). Frames in the second row are taken 100 ms, or almost exactly one spiral wave period (= 101 ms), later than those in the first row.

